It seems also that there is a performance limit. It does not allow to load the full model (highrise with lots of timber beams and columns) and aborts loading.
One more addition to that …
by interacting with the visuals the model starts to rebuild itself after every big change. It would be interesting if the visual would keep the model in memory. It seems to start loading it from scratch. Especially for medium to big projects, this would be really beneficial. But this is more icing on the cake stuff … you guys are sweeping us off our feet in a regular manner with what is already working
We’re planning on doing some more work on the PowerBI Visual for the next release cycle. This will include the language issues you’re describing above.
If you’re interested in the details, basically we were using the input name naively… but we can switch to use the QueryName, which is language agnostic (or that’s what I’ve gathered…). Hopefully this will allow the visual to work in any language!
As for this
It’s tricky… but we do have some ideas on how to improve things on this side. The main problem is that the viewer uses a local DB by default (which speeds things up considerably) but the PowerBI visual is sandboxed so it cannot use it This is done for very valid security reasons but it still makes me sad.
There are some things we could improve on the viewer side to ease this issue (some kind of new object loader), but this is all very theoretical at this point.
Forgot to answer this. PowerBI has a limitation of loading 30k objects into a visual. There are in theory some pagination strategies but I never got those to work properly.
EDIT: Not sure how massive the buildings you’re loading are… but do note that if you tell the viewer to load an object, it will also load all of it’s children, so you may be able to “reduce” the amount of objects in your table to less than 30K and still see the entire building, but it would really depend on the use-case for your report, and how granular you need the data to be.
This can be done by some filtering after receiving on the DataConnector side. You can also try our (very experimental) structured receive option that may allow for some extra control on receive (the cost of this is you’ll have to build your own data table similar to the GetByUrl result in your query)
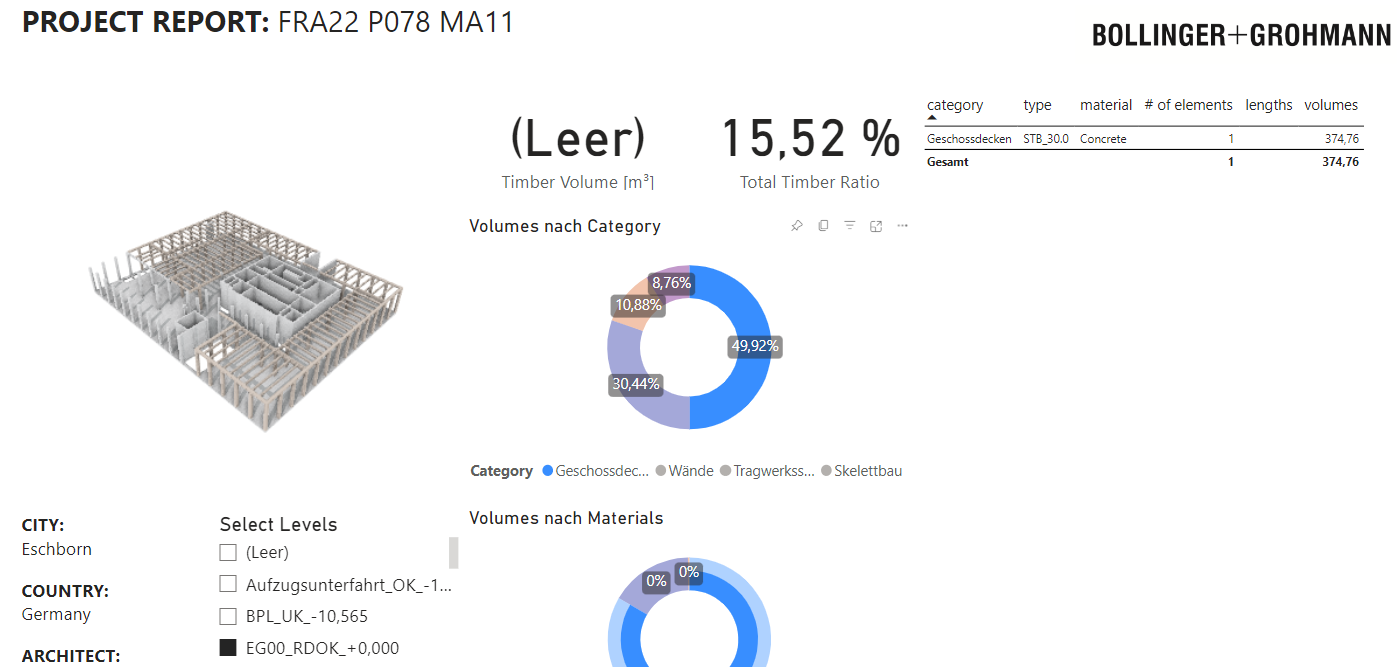
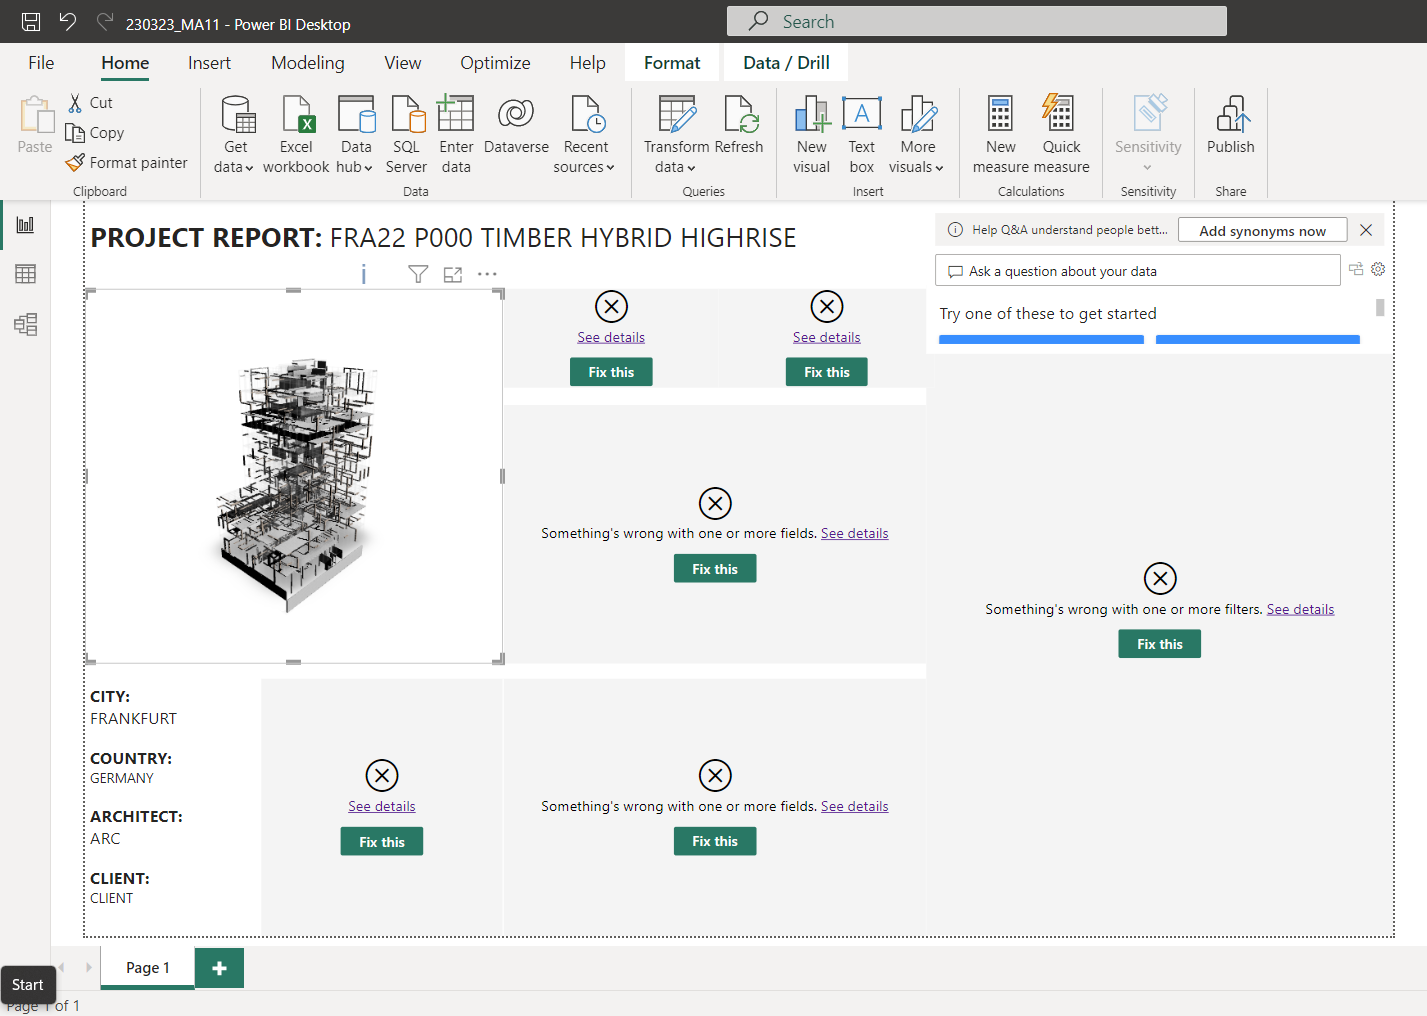
To specify the performance limit from above a bit more in detail
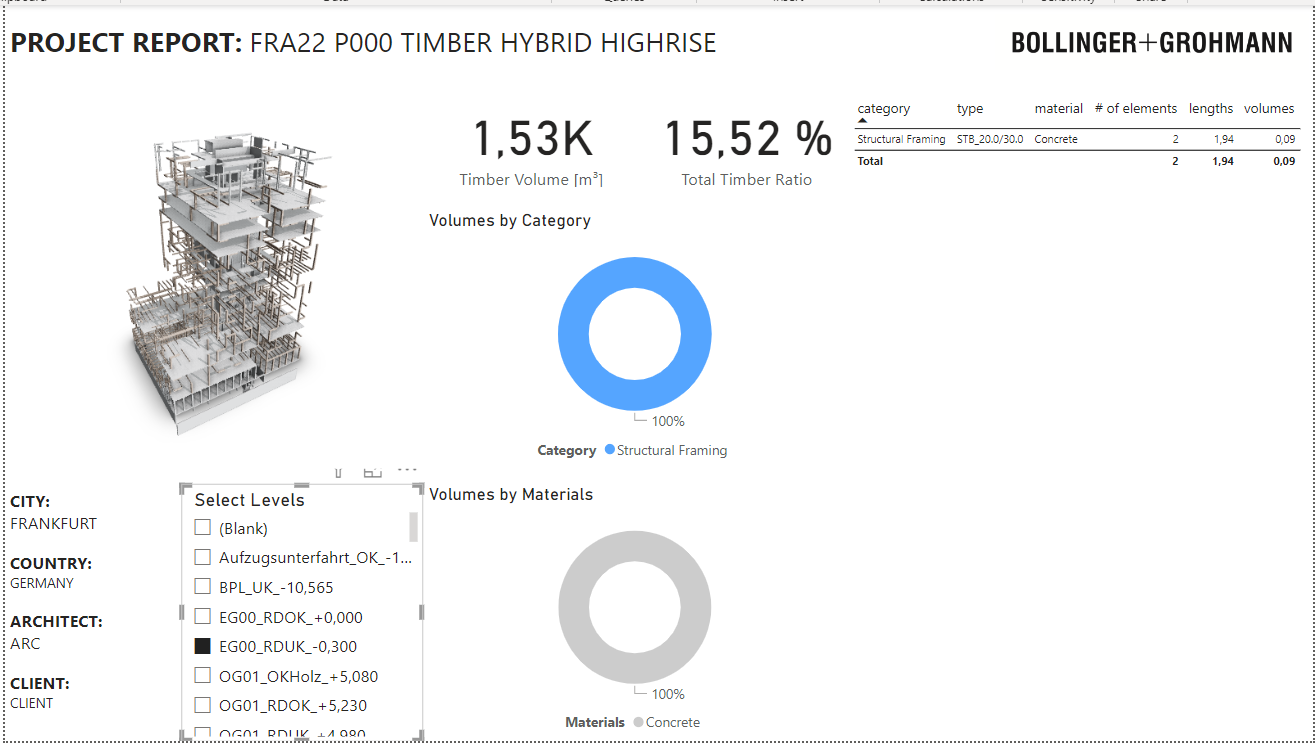
The model in the visual usually stops loading in between and looks like this abstract geometry art piece below
Regarding the amount of information, we limited the data to five parameters. The building consists of 5400 geometrical elements. We should be way below the limit of PowerBI … or it is actually another issue.
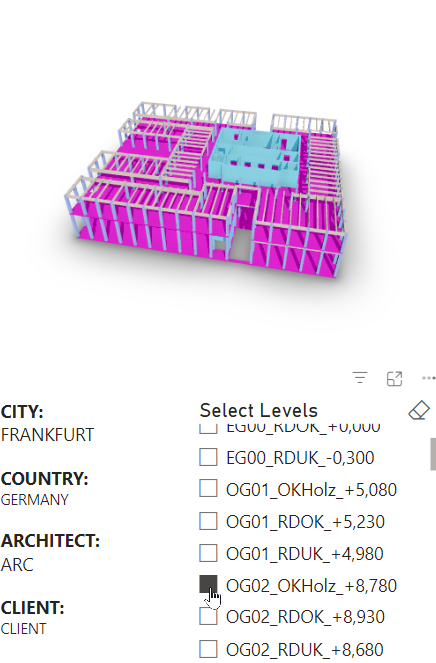
The data slicer also does not seem to have an effect on the visual after the freezing, which means there is no refresh of the visual after hitting the level slicer.
Interesting behavior with alpha version 6: I storywise switched through the level slicer … usually the elements part of the former level should vanish. Somehow it adds the new elements to the visual and the elements of the deselected level are still visible. There should only be one level in the visual not three.
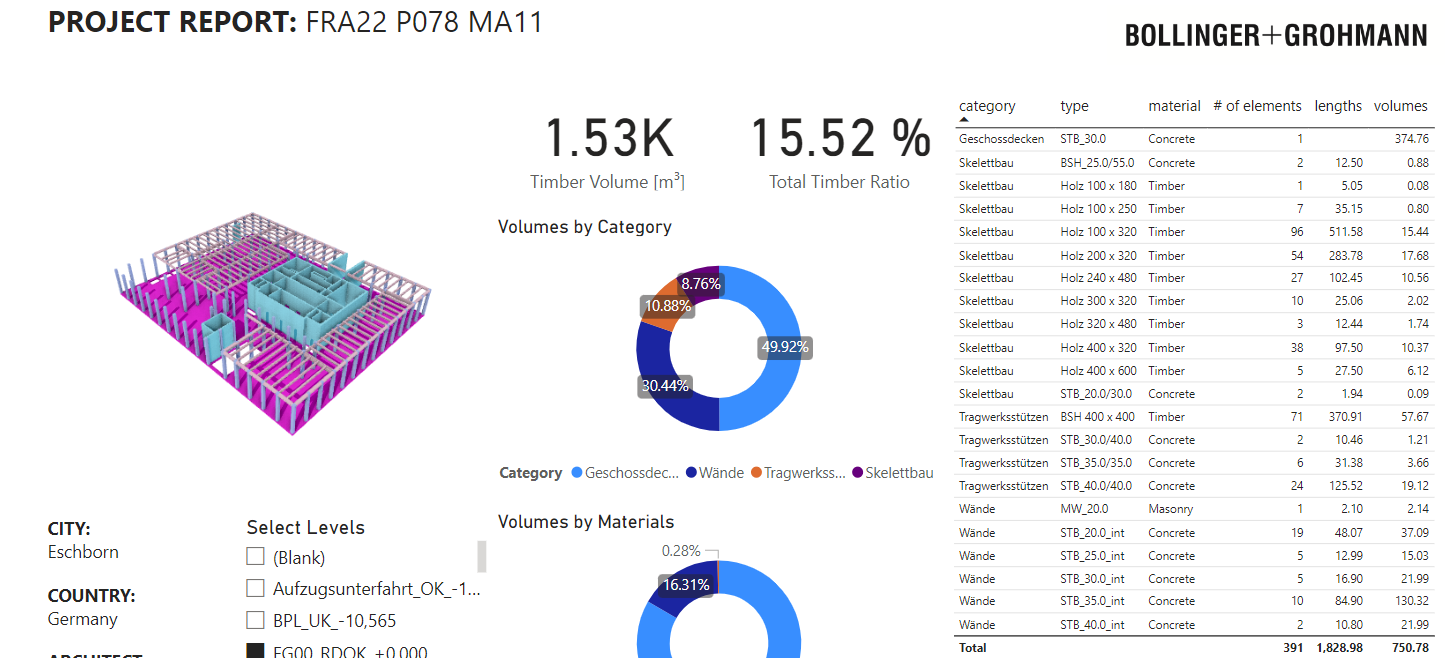
Hi @AlexHofbeck - Thought i’l share this finding with you. I am using the Revit connector to display my model in Power BI, after testing a few older versions of the Revit Connector (v2.11.0 seems to work) and reverting back to Alpha 3.0 (Power BI visual) I have managed to fully load the model into my power bi dashboard. It does take considerably longer for the visuals to load but everything is coming through so far.
FYI, I just released this morning a new version of both the Data Connector and the 3D Visual.
I still have to update the docs (next week), but if you’re keen feel free to give it a try! It should definitely fix your issues with the missing objects on load
You’ll need to update both, as the data connector has a new column in it’s output table that is required as input for the visual to work.
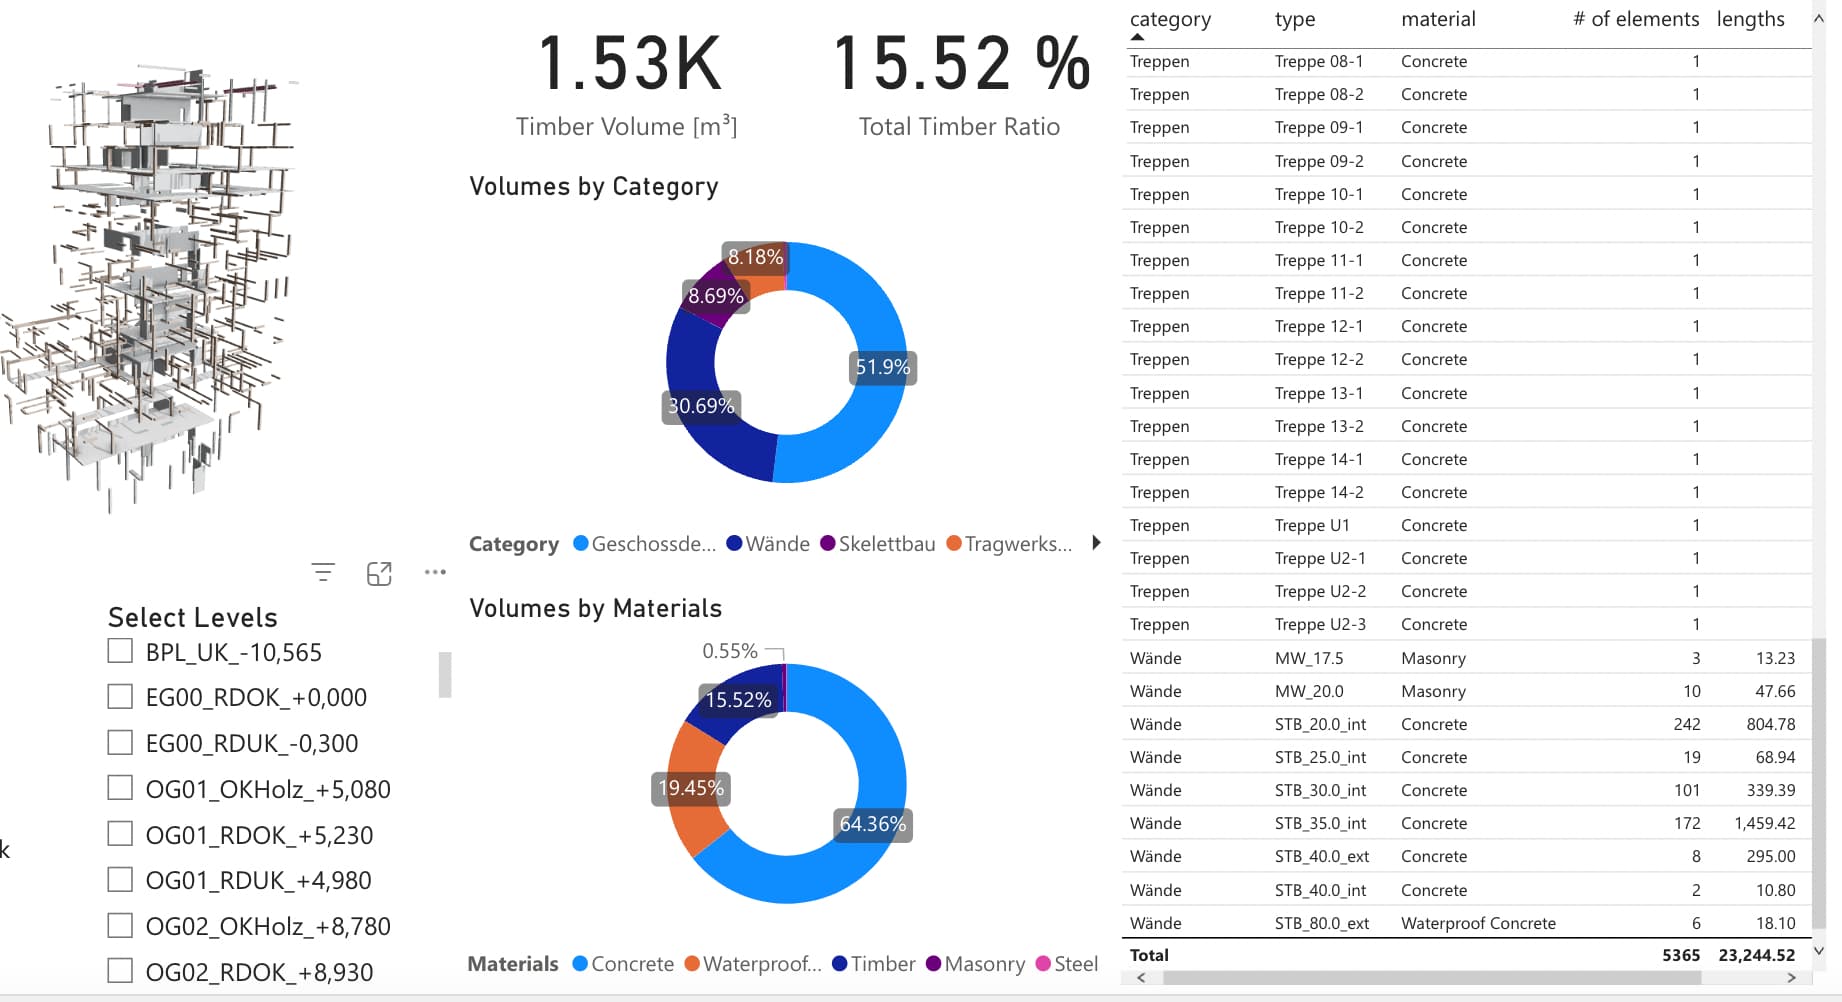
The loading seems to still be an issue on my side … the building loads quicker but only partially … ignore the “fix this” this is the missing data due to the new query based on your new *.mez file
The coloring linked to the chart visual seems to not be working … in case this is already implemented by you. It seemed that way in another image I have seen on this forum. This was what I recognized on another example dashboard
The latest version of the visual still works the same way the old version did with regards to “what objects are displayable”, but has changed the way they were being loaded so that it won’t hit the Rate Limit on the server side.
So right now:
We will load all objects in the commit object id column (which will load the entire commit that row was originating from)
We will ghost any objects that are not in the Query table, as interactivity in the visual only works with objects that exist within the report.
We’re planning on making this a user setting in the visual for the next release, so that you can choose between ghosting (the current behaviour), completely hiding them or displaying them.
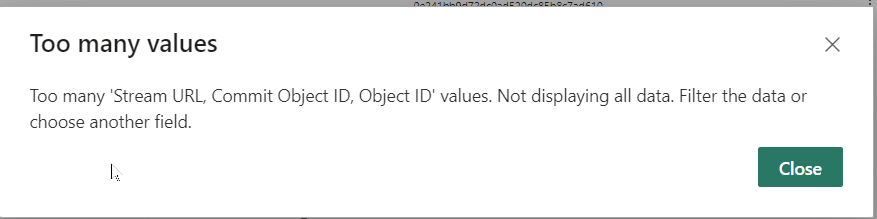
As for your report, it seems you have an alert ! icon on your visual, would it by any chance be telling you that you have more than 30k objects?
If so, i suggest applying a slicer per level, which will reduce the amount of objects going into the visual.
Sadly no … that is what I took a look already last time … we are below that … so this is what we could exclude from the list of issues. I have also reduced the amount inside the query
Exactly what you mentioned … then this limit is more related to the data than the rows. Okay … then we have to do it only for the small to medium projects