New! ✨ PowerBI Visual 2.0.0-alpha5

Hi @AlexHofbeck!

Sorry for the late reply, we’re currently having a company retreat and we’re a bit les responsive.

For the parameters, I think you need to remove the data prefix when expanding data column for the first time (you can edit your query to change this). This is automatically introduced by powerBI and I’ll admit its a bit of a PITA to remember this every time.

I’m actually looking for ways to improve this in some way, but for now we’re stuck with this strategy :smiling_face_with_tear:

Could you send me a report where this happens? I’ve tried on my side and the selection logic from Table->Viewer seems to work as expected (ghosting non selected elements). This is not the case going form Viewer->Table as it seems PowerBI’s logic is different.

Amazing work getting the 3D viewer released, I’ve been testing it out (version 2.0.0) and noticed that it seems to work as expected when first configured (two-way filtering between 3D viewer and table visuals, and colouring by Object Data), but it seems stop functioning after a few minutes of manipulating the filters… I haven’t been able to isolate exactly what causes it, but it seems to be primarily the viewer stopping any updates/rendering.

The other visualisations (Slicers/Table/Matrix) still operate as expected and filter the data between them, but the 3D visual is frozen. Oddly enough, if I continue to click on elements, they continue to filter the other visualisations, however the “View” remains frozen.

I can create a new page and recreate the layout but it seems to stop functioning again after a relatively short period of time.

Wondering if potentially a “refresh” or similar button would be able to resolve the issue?

Edit: Navigating to another page and returning appears to reset the visual which is great. I’ve also found that applying a filter to exclude anything with a “speckle_type” value of “Objects.Geometry.Mesh” improves the performance significantly. So it may just be some dirty sample models that I’m testing with.

Hi @BrettB! Welcome to our community :rocket:

Interesting, I must say I haven’t been able to experience this issue myself, but I have fixed a couple of bugs regarding the update behaviour that did prevent it form succeeding.

Sadly, I’m not sure these fixes would address the issue you describe. I’ll have to do some more digging but if you could share a report file where this happens it may help pinpoint it faster.

I’ll keep you posted when we make a new release (soon!) so you can test that version too.

Excluding meshes

As for the speckle_type trick to exclude meshes, you are correct that this results in a speed increase, this is the “expected behaviour” in a sense (but we’re still planning on improving this).

The way the data connector works, it will spit out a flat list of objects contained in your commit. This means that for every “Displayable object” (such as a wall, a floor, a window…) you will also get in the same list it’s mesh representation (usually stored in it’s displayValue property.

When the viewer loads that flat list, it will encounter the Wall object and load it’s displayValue, but will also encounter the mesh from the wall, which results in it being loaded twice.

Do note that if you exclude all meshes, commits from Rhino and Grasshopper would appear to be missing mesh objects as a result.

In general, it’s best to fix this on the Data Connector query, and just pick whatever objects you want, or exclude whichever objects you don’t. This way you’ll also be able to benefit from some improvements in performance we’ve planned on the Data Connector side.

Another suggested strategy would be to use the new Structured way of getting data from our Data Connector, which will allow you to craft your own queries, resulting in way faster loading times and better control over the final objects in the table. The only downside is that generating that final table is up to whoever crafts the query (the table with Stream URL, Object ID columns produced by the original Get By Url)

Hope this helps!

1 Like

Hi Alan,

we prevented the prefix “data” during the expansion of the data. It still did not work as expected. Might be a user error but my colleague had the same outcome, independently from me. Also changing the models leads to the same results.

I have a tiny model here:
Commit | Speckle

and after getting it into the PowerBI and selecting the parameters it only shows the two elements with the parameter values in the viewer and hides the rest. But also does not add colors. Expected behavior would be to show everything and color the only two elements with parameter values accordingly.

Dashboard1.pbix (1.5 MB)

2 Likes

Hey @AlexHofbeck,

sorry for the delay looking into this. It turns out it’s a simpler issue than I thought!

PowerBI will automatically add a prefix to your inputs (which is dependent on your system language), but the Viewer is only prepared to handle these in English.

I’ll look into what options are available for i18n in PowerBI and how we can go about it, but meanwhile you can just edit the name of that input on the visual and remove the prefix so it’s just parameters.XXX...

Screenshot 2023-02-14 at 10.00.58

It also works if your PowerBI is in english :sweat:

Here’s a link to the issue: Input name cleanup does not work when language is not English · Issue #21 · specklesystems/speckle-powerbi-visuals · GitHub

1 Like

Thanks @AlanRynne for looking into it :slight_smile:. I have changed the language to English in PowerBI

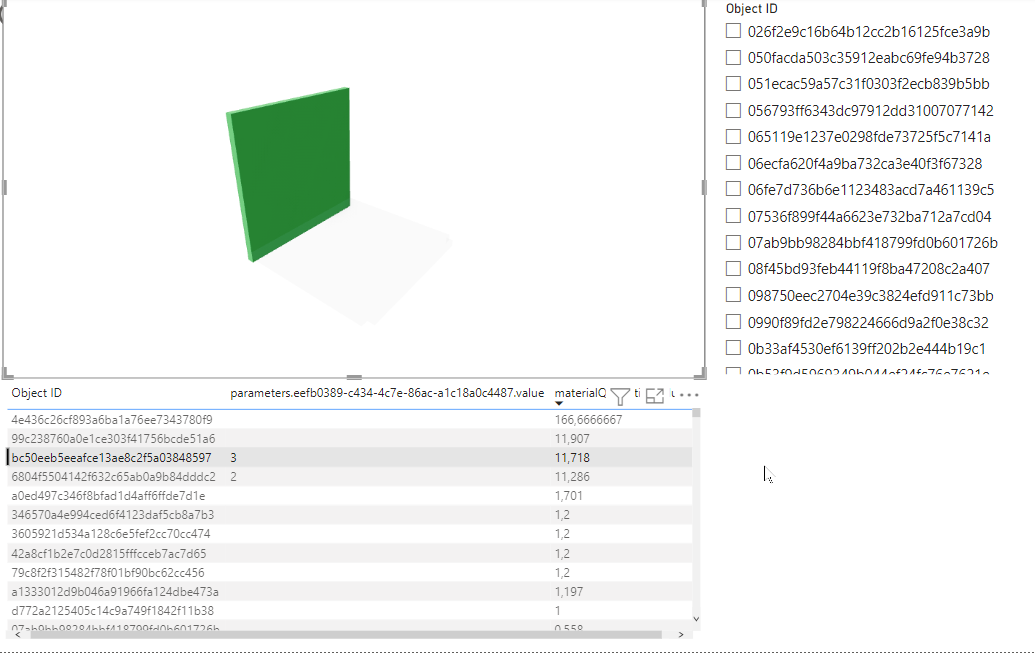
In English also the selection of data works nicely … it seems to be a total language issue then :slight_smile:

3 Likes

Hi Speckle,

Thanks for this great update, it works much better than last time. The progress so far has been tremendous.

  • Response times seem improved and can now render more model items quickly.

  • I just wonder is there a way to adjust the transparency of the “ghosted” objects? (I saw this feature in other PowerBI custom visuals on the market and I think it will be good to see it in speckle also)

  • Can we have a tool to see different predefined views like a navigation viewport gizmo in Blender?

  • Is there a way to add a sectioning tool for 3D views?

Please see below videos that I created using the latest version:


The next step for me is to test it with more complex projects.

Again thanks a million for this custom visual.

Kind regards

2 Likes

Hi all,

do you tried to import a Navisworks stream in PowerBI?
I can import and see all the data in Power BI


but I can’t see the 3D model

Thanks

Mirko

1 Like

Can I ask if you could share a simple model and stream so that we can take a look?

We’ve discussed separately how the data shape of a Navisworks commit is, on one level, simple but, on another, arbitrary. It has very nested objects, and the visible geometry is at indeterminate ‘depths’.

Supporting workflows from Navisworks into Excel and PowerBI is very high on my agenda once Navisworks starts moving out of alpha. Still, it is really useful to see if we can improve how it supports it as early as possible. :sos:

1 Like

Hi @jonathon

I sent you the invitation on my Navis stream.
Don’t hesitate to contact me if you want to do same test togheter.
Thank you for your support.

Mirko

1 Like

Perfect, I’ll take a look when I have enough time to concentrate on it. It will be helpful for me to write some usage notes and documentation.

@jonathon it was a problem of settings in PowerBI. Now it’s run


Thanks for your support
Mirko

1 Like

Hello, it is my first post here, hence let me express how impressed I am with the progress you made on the topic. I am a big fan of power bi as a PM’s reporting tool.

I am testing the speckle/powerbi functionalities on a super simple model and come across some issues that I would like to share:

  1. it seems there is some limitation as to which columns are recognized in the “Object Data” field. They must come from the “first expansion” of data column in power query. Further expansions of nested items seems to be not recognized.
  2. If the above is planned than this is clear, but would it be possible to make other columns recognized? For example I am a PM who receives a model and i would like to colour the view by 3 digits, that I can add based on a rule in power query. This way I do not need to bother the modeller and still deliver my report.
  3. A few changes to what is in the “Object Data” field causes the bi-directional filtering to crash and requires file restart.

That Is all from me.
Best

BZ

2 Likes

Hi @bartekz

Welcome to our community! Thanks for taking the time to come back to us with feedback!

Could you share the report you’re using to reproduce this issues? What you describe should work already.

I haven’t experienced this. I’d need to look into this more. Could you explain what are the steps you’re taking to get it to crash?

1 Like

Hi all,

I tried to import a 3D model with 70k elements but I get this message.
Do you have any solution to fix this problem?

Thanks

Mirko

Sadly that’s a known limitation of PowerBI visuals: they can only load up to 30.000 objects at any given time.

There are pagination strategies (aka, load 30k at a time, and choose which “page” you want to see) but those won’t help in the case of a 3D viewer unless we come up with some higher level strategies (paginate by floor?)

Our current recommendation is to filter out whatever you don’t need in your visualisation, since the way GetByUrl works will spit out all nested objects as a flat list.

You can filter out objects in a smart way to remove some duplication. If you’re model is coming from Revit for example, you can exclude any geometry objects because loading a wall in the viewer will load it’s containing mesh (anything with speckle_type starting with Objects.Geometry)

You can also give a try to our Structured receive option to just get the objects you want, but it does require some light powerquery editing to get the “stream id” and “object id” columns, as the output of this query will be the raw objects (essentially, the data column of GetByUrl alone`)

1 Like

hi @mirko.maccarronello, I am having the same issue. Could you please let me know which settings in PowerBI did you have to change? Thanks!

This is a fantastic addition to PowerBI. I am however experiencing significant lag when attempting to interact with full building models. My company does utilize a 3rd party addin to export revit models and data to 3d visuals within powerBI and it does not suffer this lag. Has there been any thought to pushing the data to static files instead of streaming from the URL? Often our field team’s internet is spotty at best and being able to package a report with static content could be helpful.

1 Like

This indeed is something we are investigating.

1 Like

What third part app you are using?