With a Speckle in-person retreat over, I thought I’d sun myself in glorious Athens for a few days. The snow and ice rain had other ideas. So my mind wandered, as I did through the gridded streets, around to Speckle Server metadata.
We have seen a few ways how you can access your Speckle data outside of 3D authoring apps. The PowerBI and Excel apps, the GraphQL and REST APIs, or the true data nerds knee-deep in the data using C# and specklepy SDKs.
But in addition to your data, there is also data about the data – how meta!
In this simple python or Jupyter notebook example, we will use the Speckle GraphQL API to get your server contributions and plot them in a nice graph akin to the GitHub contributions graph. This could be performed as part of a Project Stream activity dashboard.
Firstly some packages we’ll need:
%pip install graphqlclient
%pip install pandas
%pip install calmap
With all that boilerplate done with, we can now get our data from the API. We’ll use the userSearch query to get our user object and then the timeline query to get our contributions.
First, we can set up our client. This is a super easy method and doesn’t need us to mess around with an HTTP client or anything. We need to pass in the URL of the server we want to query and a Personal Access Token (PAT) that we can get from our user profile page.
NB: As ever, don’t share your PATs with anyone - this includes publishing on Github!
from graphqlclient import GraphQLClient
client = GraphQLClient('https://speckle.xyz/graphql') # notice the trailing endpoint
client.inject_token('58...long bit of string...f6')
Because I’m a special snowflake, I have multiple accounts on the same server, so I might need to specify which one I want to get the data for. I can do this by passing the user parameter to the userSearch query.
Or, brute force it by passing in all the usernames I want to get data for. I could then filter the results to get the one I want.
For those unfamiliar with GraphQL, it allows us to specify what data we want a server to respond with when we query it. It could still be a lot, but it puts you in control of the data shape coming back.
import json

emails = ['jonathon@st__p.com', 'jonathon@speckle.sys__s']
data = []

for email in emails:
    result = client.execute(f'''{{
      userSearch(query:"{email}"){{
        items {{
          id
          timeline(limit:999999,after:"2022-01-01T00:00:00Z") {{
            items {{
              userId
              streamid
              actionType
              time
            }}
          }}
        }}
      }}
    }}''')
Get the JSON of the result and add it to the data list. Some actions in a user’s timeline are the actions of others. e should filter those out too.
    loaded = json.loads(result)
    filtered_data = [item for item in loaded['data']['userSearch']['items'][0]['timeline']['items']
         if item['userId'] == loaded['data']['userSearch']['items'][0]['id']]
    data = data + filtered_data
With the raw data grabbed, a helpful Panda DataFrame is created for us to play with.
As the comments in the code show, all those individual events are a bit granular to plot. In addition, we are interested in a day count, so we’ll group them by year, month and day and count them. This is to mimic the GitHub contributions graph.
The count column is the number of contributions on that day. In this case, any action on the Speckle server counts as a contribution. Because the query above includes the actionType parameter, we could filter the results only to include specific actions. For example, if we only wanted to count commit_created, we could. I have left it in the server query for this reason.
import pandas as pd
import datetime as dt

# Load it into a pandas dataframe
df = pd.DataFrame(data)

# Convert timestamp to datetime and extract year, month, and day
df['time'] = pd.to_datetime(df['time'])
df['year'] = df['time'].dt.year
df['month'] = df['time'].dt.month
df['day'] = df['time'].dt.day

# Group by year, month, and day, and count the number of events
df_grouped = df.groupby(['year', 'month', 'day'], as_index='count').size().reset_index()
df_grouped.rename(columns={0:'count'}, inplace=True)
I know a previous forum demo involving pesky Pokemon skews my results by a whopping 2000 contributions, so I’ll clip the data to the 90th percentile to get a more typical graph. You may not need this or find a different algorithm helpful to massage the result.
See where that phrase “Only trust the statistics you made up yourself.” comes from!!
threshold = df_grouped['count'].quantile(0.90)
df_grouped['count'] = df_grouped['count'].clip(upper=threshold)
The previous grouping smooshed our timestamps out of existence - we need that to map to a calendar later. So we’ll add it back in. It will be more coarse than the original data, but that’s ok.
# Create a timestamp column from the year, month, and day values
df_grouped['timestamp'] = pd.to_datetime(df_grouped[['year', 'month', 'day']])
df_grouped = df_grouped.set_index('timestamp')
For the graph, we’ll use the CalMap package. It is a little crusty and could benefit from a bit of TLC to bring it up to date with modern Pandas, but it does the job.
Open source loves contributions. If you want to help out, you can find the repo here.
The graph will need to know what value to use to grade our contributions, so we’ll use a Pandas Series command on the grouped data. The calculation for the relative colouring is handled by the calmap package.
events = pd.Series(df_grouped['count'])
Github has YellowGreen as its all too familiar chart, so to plot the graph in lovely Speckle Blue (all varieties of them)
import calmap

# Plot the data using `calmap`
plot = calmap.calendarplot(
    events,
    daylabels='MTWTFSS',
    dayticks=[0, 2, 4, 6],
    monthticks=3,
    how=None,
    fig_kws=dict(figsize=(20, 10)),
    linewidth=0.5,
    cmap='Blues')
Only the events field is strictly mandatory here; designers gonna design.
So for the last 2 years on speckle.xyz, these are my contributions:
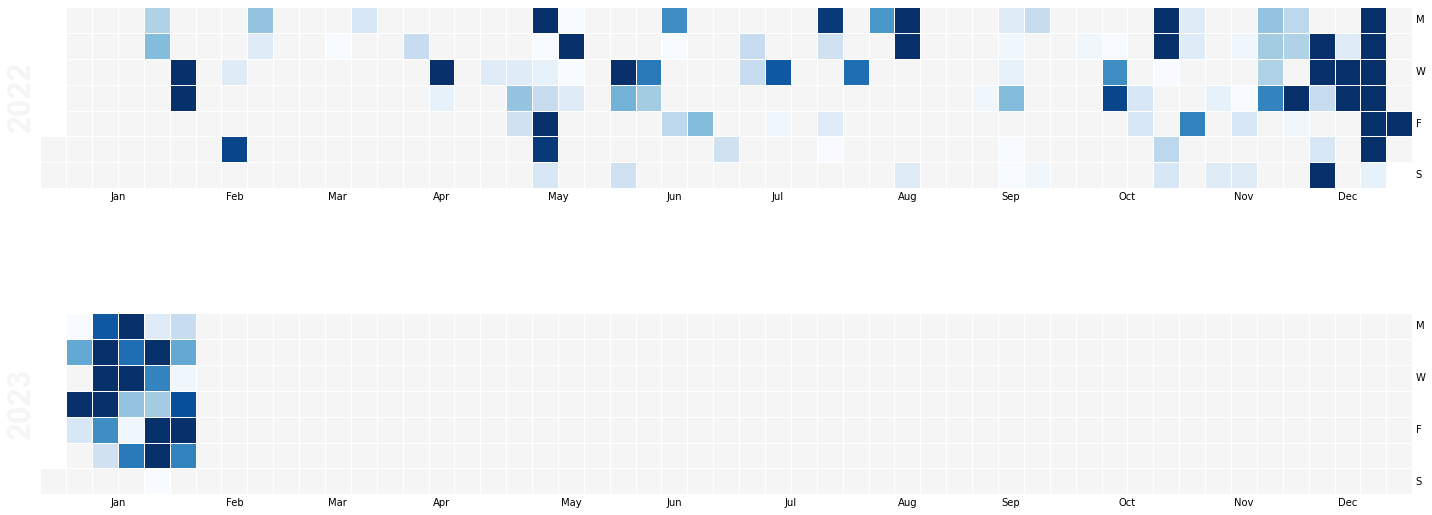
These could be further partitioned by any of the 4 data points I included in my query: userId, streamId, actionType
Others on the Speckle Team may scoff that they fill the chart :D, but if nothing else, testing and releasing a Connector certainly ups one’s game ![]()