I followed the workflow of these topic, since I would like to avoid any new subscriptions.
However, I did some changes. One difference is that I export the clash report to excel in xml format and then process its data through power query. I use this spreadsheet to group and classify the clashes.
Another difference is that in my dasboard I want to analyse all the clashes, instead of checking its progress.
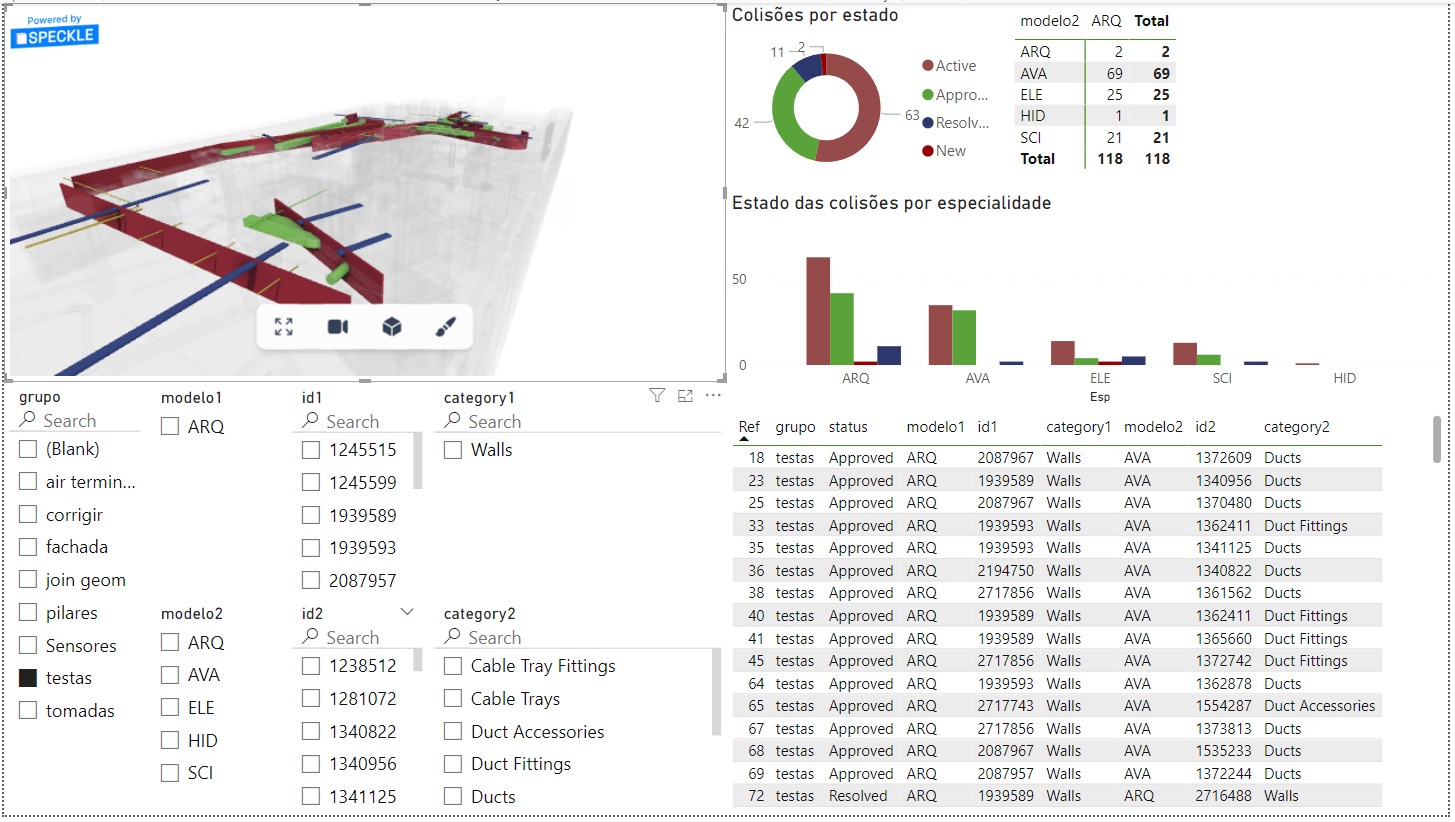
For that I use the 3D Viewer, a few charts and some filters. Here is a sample image of the dashboard i created:
It works fine until i start to use the slicers.
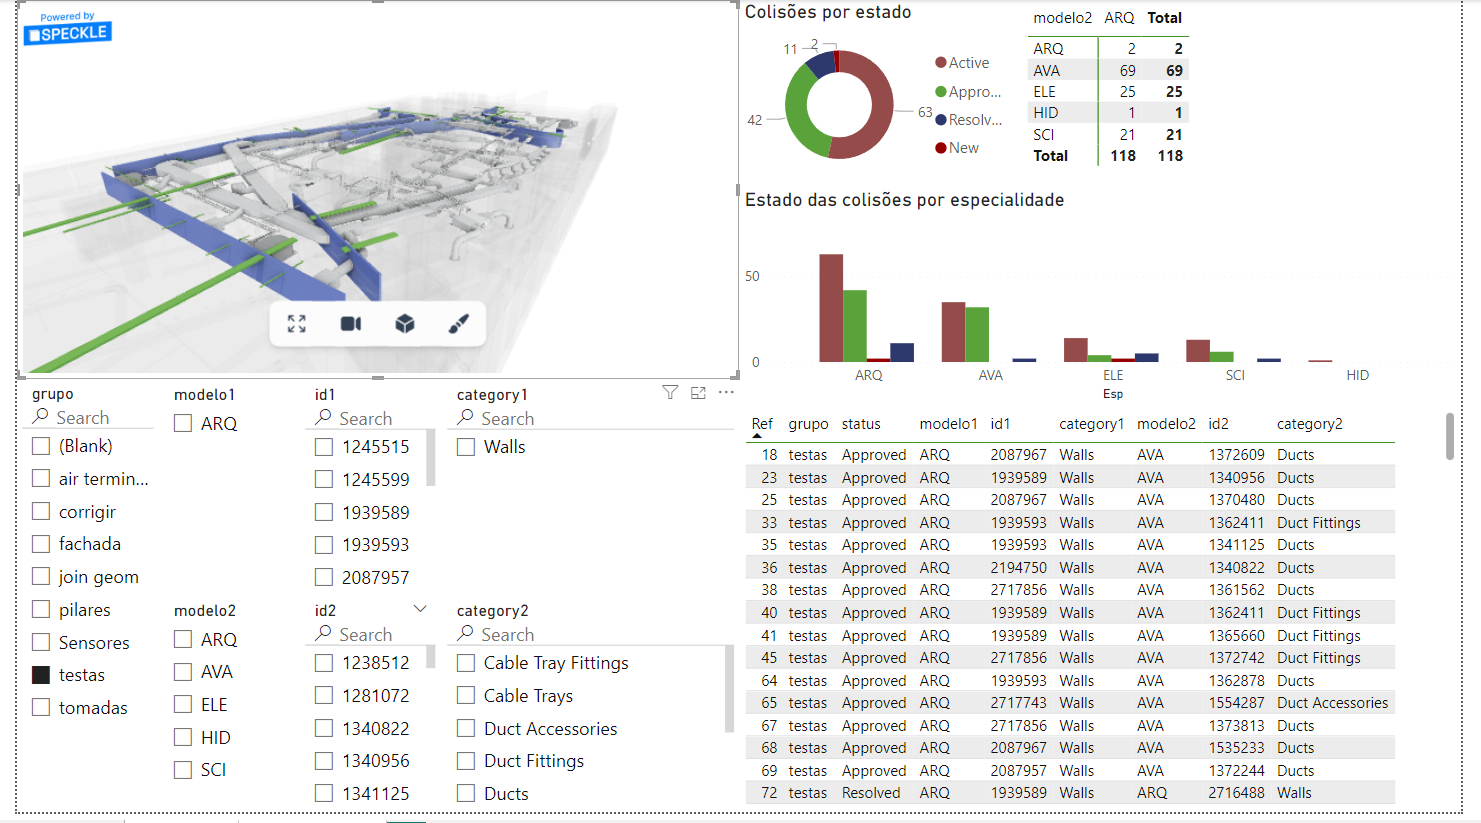
Sometimes, when I use multiple filters, the 3D viewer loses connection with the slicers and I have to restart the 3D viewer, which sucks. The image bellow is an example of that.
Regarding the screenshots, I will explain and sorry for not making it clear before.
In the first image, the 3D Viewer has the elements colored by FileName (Red - Architecture; Blue - Electrical; Green - HVAC; Yellow - Fire Safety) and only the elements related to the clashes associated with the “testas” Clash Group are visible. All the others are ghosted.
In the second one, all HVAC elements are visible (appearing gray in the viewer) and are no longer affected by filters. Additionally, the color code was lost. The Architecture is now identified in Blue, the HVAC has no associated color and all other elements are green, regardless of their FileName.
Note that in the clash matrix (top right corner), the total number of clashes remains at 118.
@jonathon that’s good news.
In meanwhile, I’ll try to find how to relate the data from the xml clash report to the clashed elements in each branch - I don’t know yet if it is possible.
@gokermu
If I can help with anything, just say so.
I was able to reproduce the issue and have logged it in our backlog. We’re working on a fix and will keep you posted on any updates. Thank you for bringing this to our attention and for your patience!
I came across your post about the clash report Power BI dashboard and the issue with the 3D Viewer losing connection with the slicers when multiple filters are applied. I wanted to ask whether you ever managed to fix or improve that issue.
I’m working on something very similar at the moment, and your workflow looks really close to what I’m trying to achieve. If you’re open to it, would you be willing to share the file or a sample version for review? It would be really helpful to understand how you structured it and see whether the slicer issue can be resolved.