Hi, I am watching the online tutorial regarding visualize rhino model in Power bi.
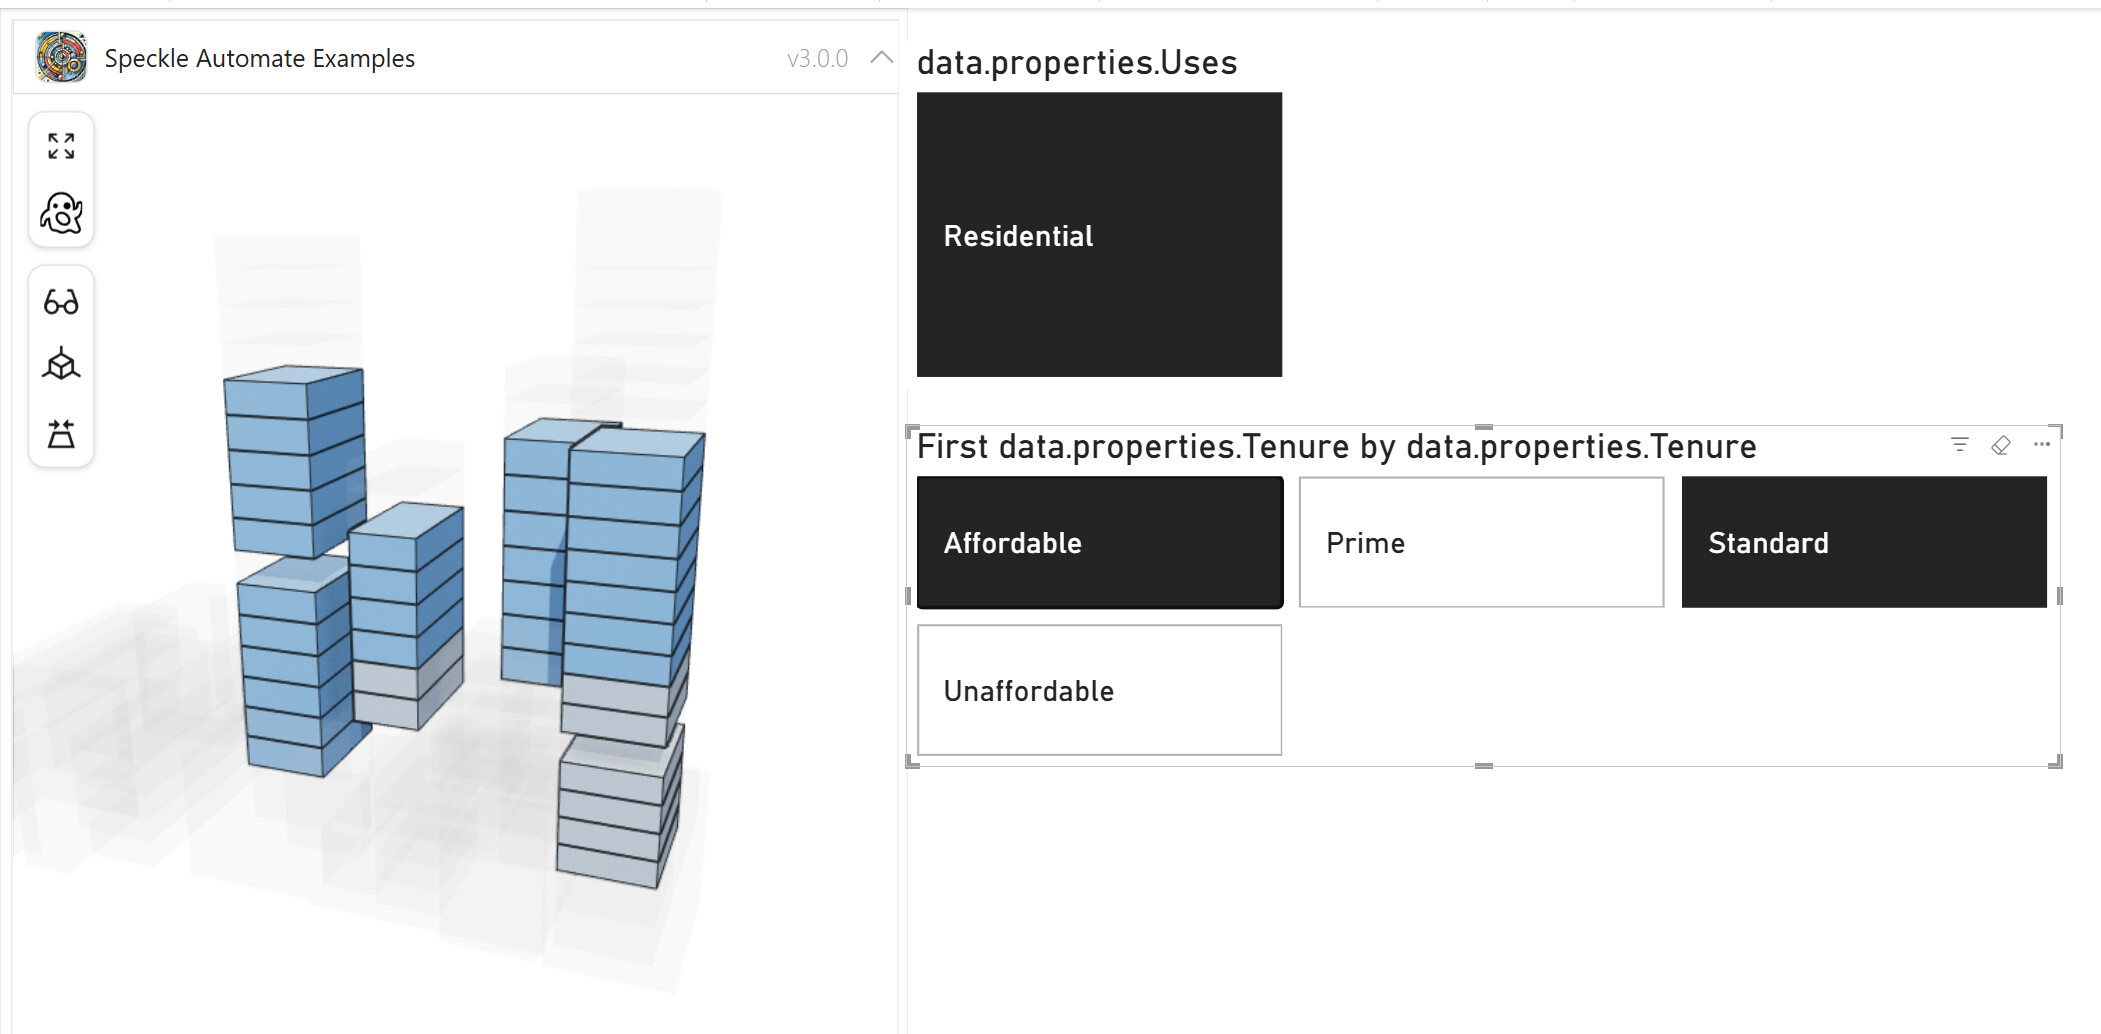
I successfully load the model in the power bi and I wonder how to create the visual that highlight the different elements ( i.e. around 4:34 in the video below https://www.youtube.com/watch?v=cld-zU3ttGY) ? Do I need to rename rhino layer? or update some data in speckle or in power bi?
May I ask how do I include that data? is it somewhere in rhino interface or Speckle interface? or through Power BI “Transform data” that I add a new column in the spreadsheet? If it is the last option, how do I tell from the object ID?
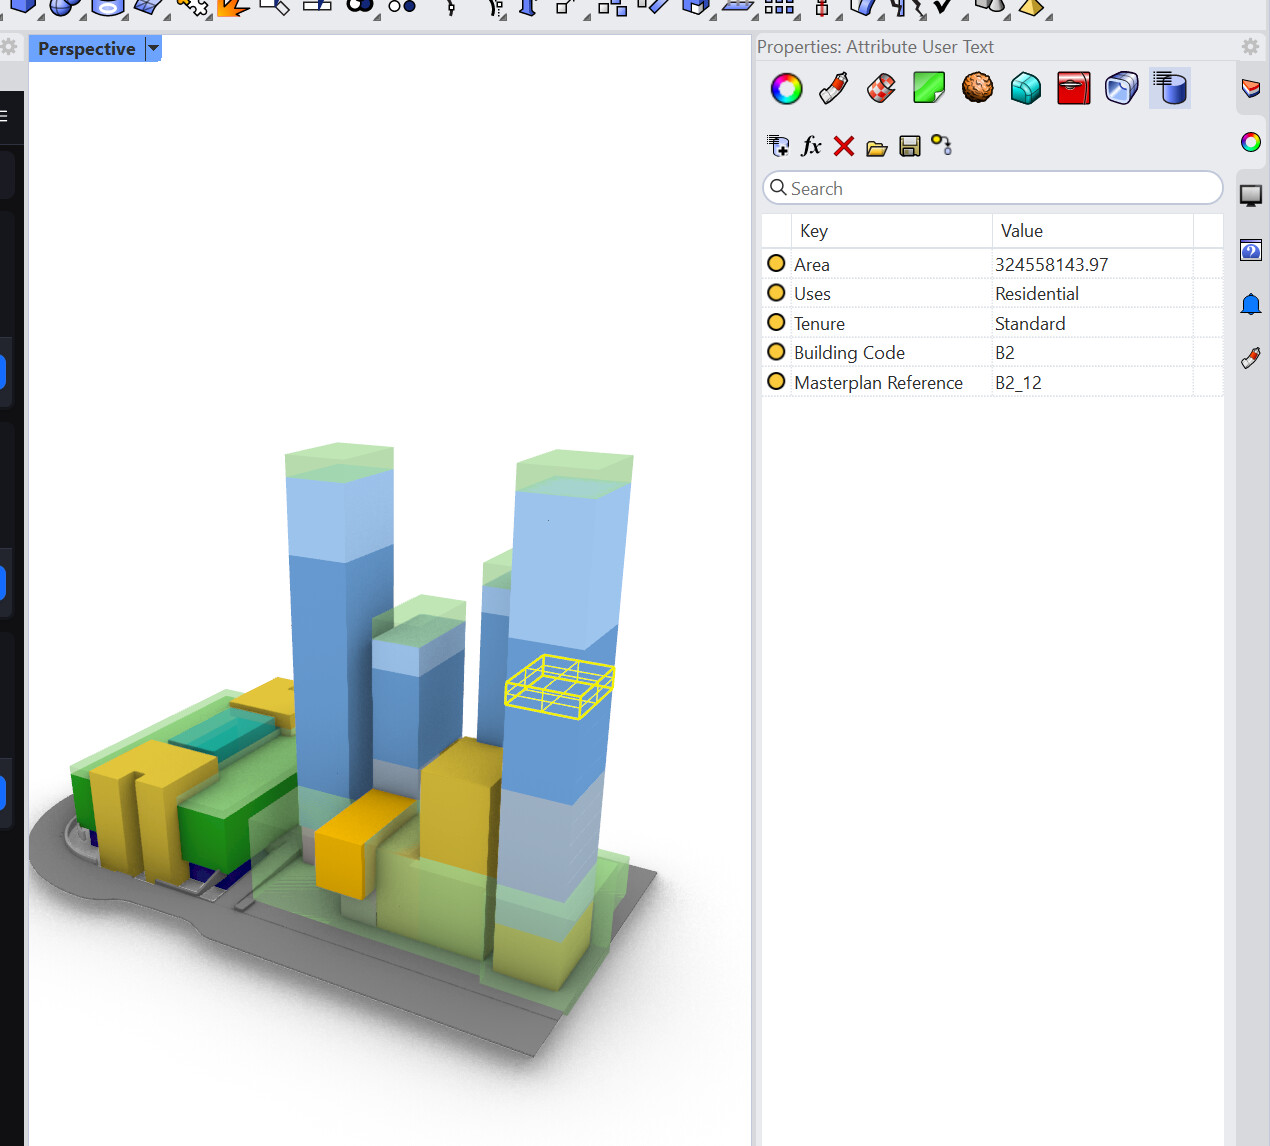
The simple Rhino masses have User String data attached. The demo is just of a master plan with uses applied to volumes. User strings are manually added to single or groups of objects. You can make any Key and Value pairs you like.
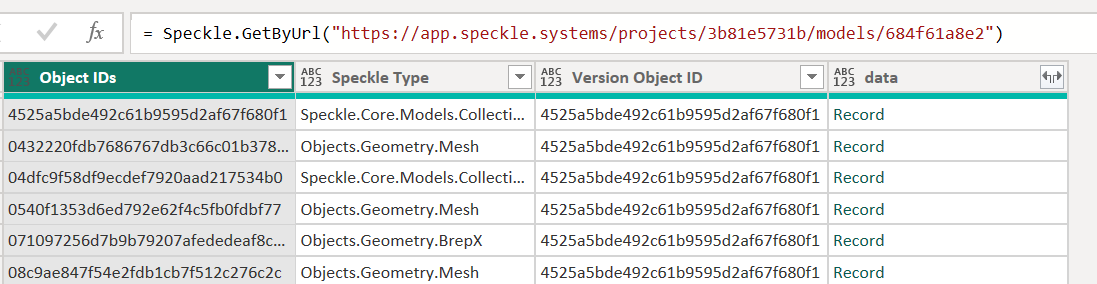
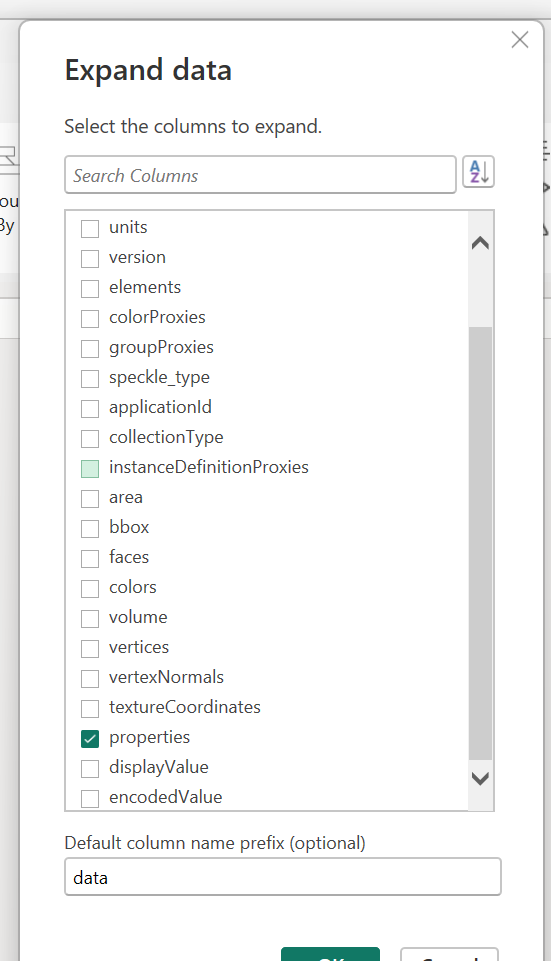
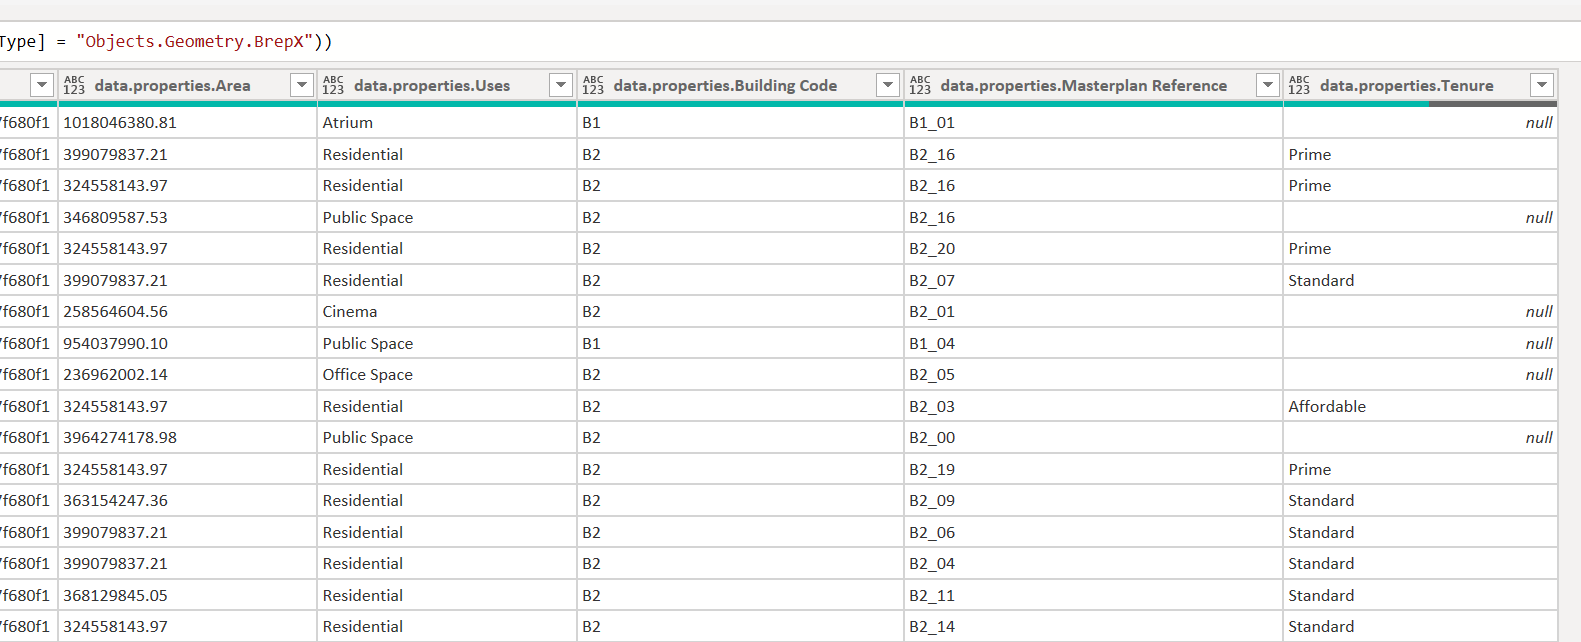
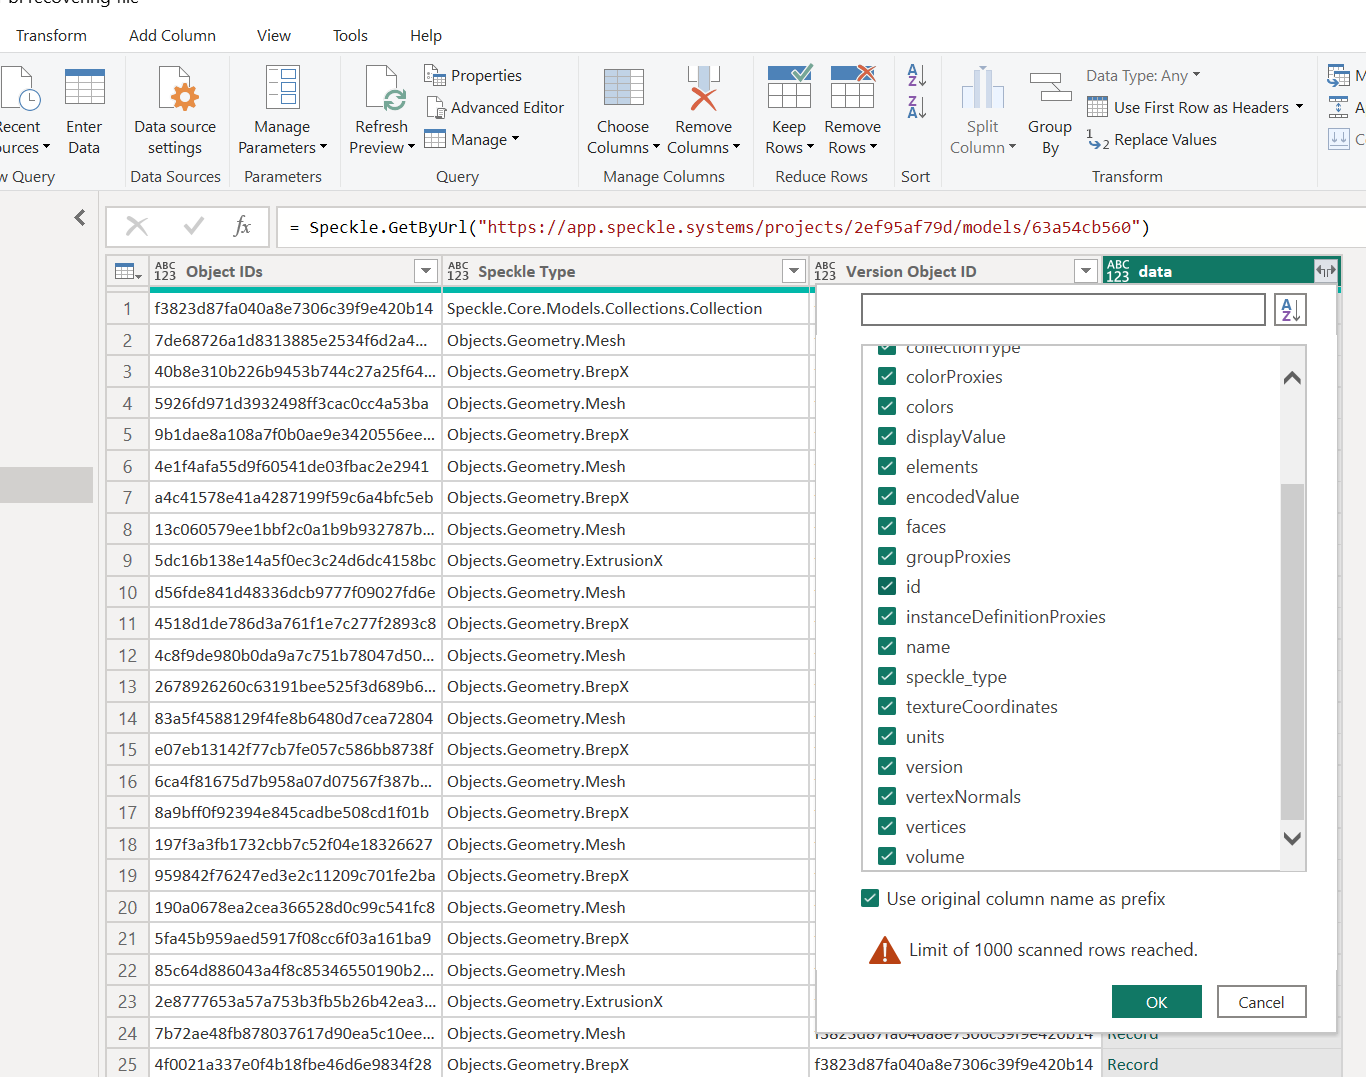
When loading this into PowerBI, I can edit the query / transform the data to reveal these data points.
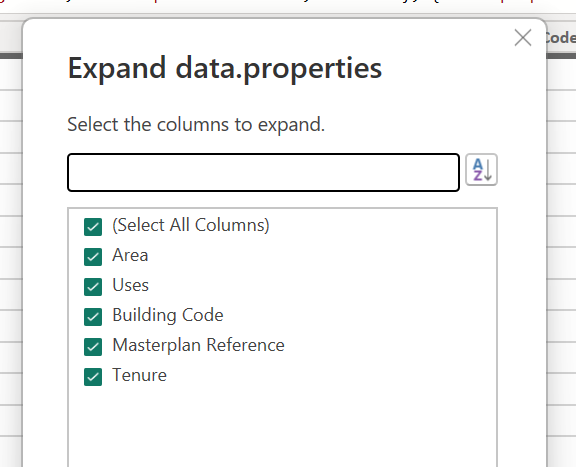
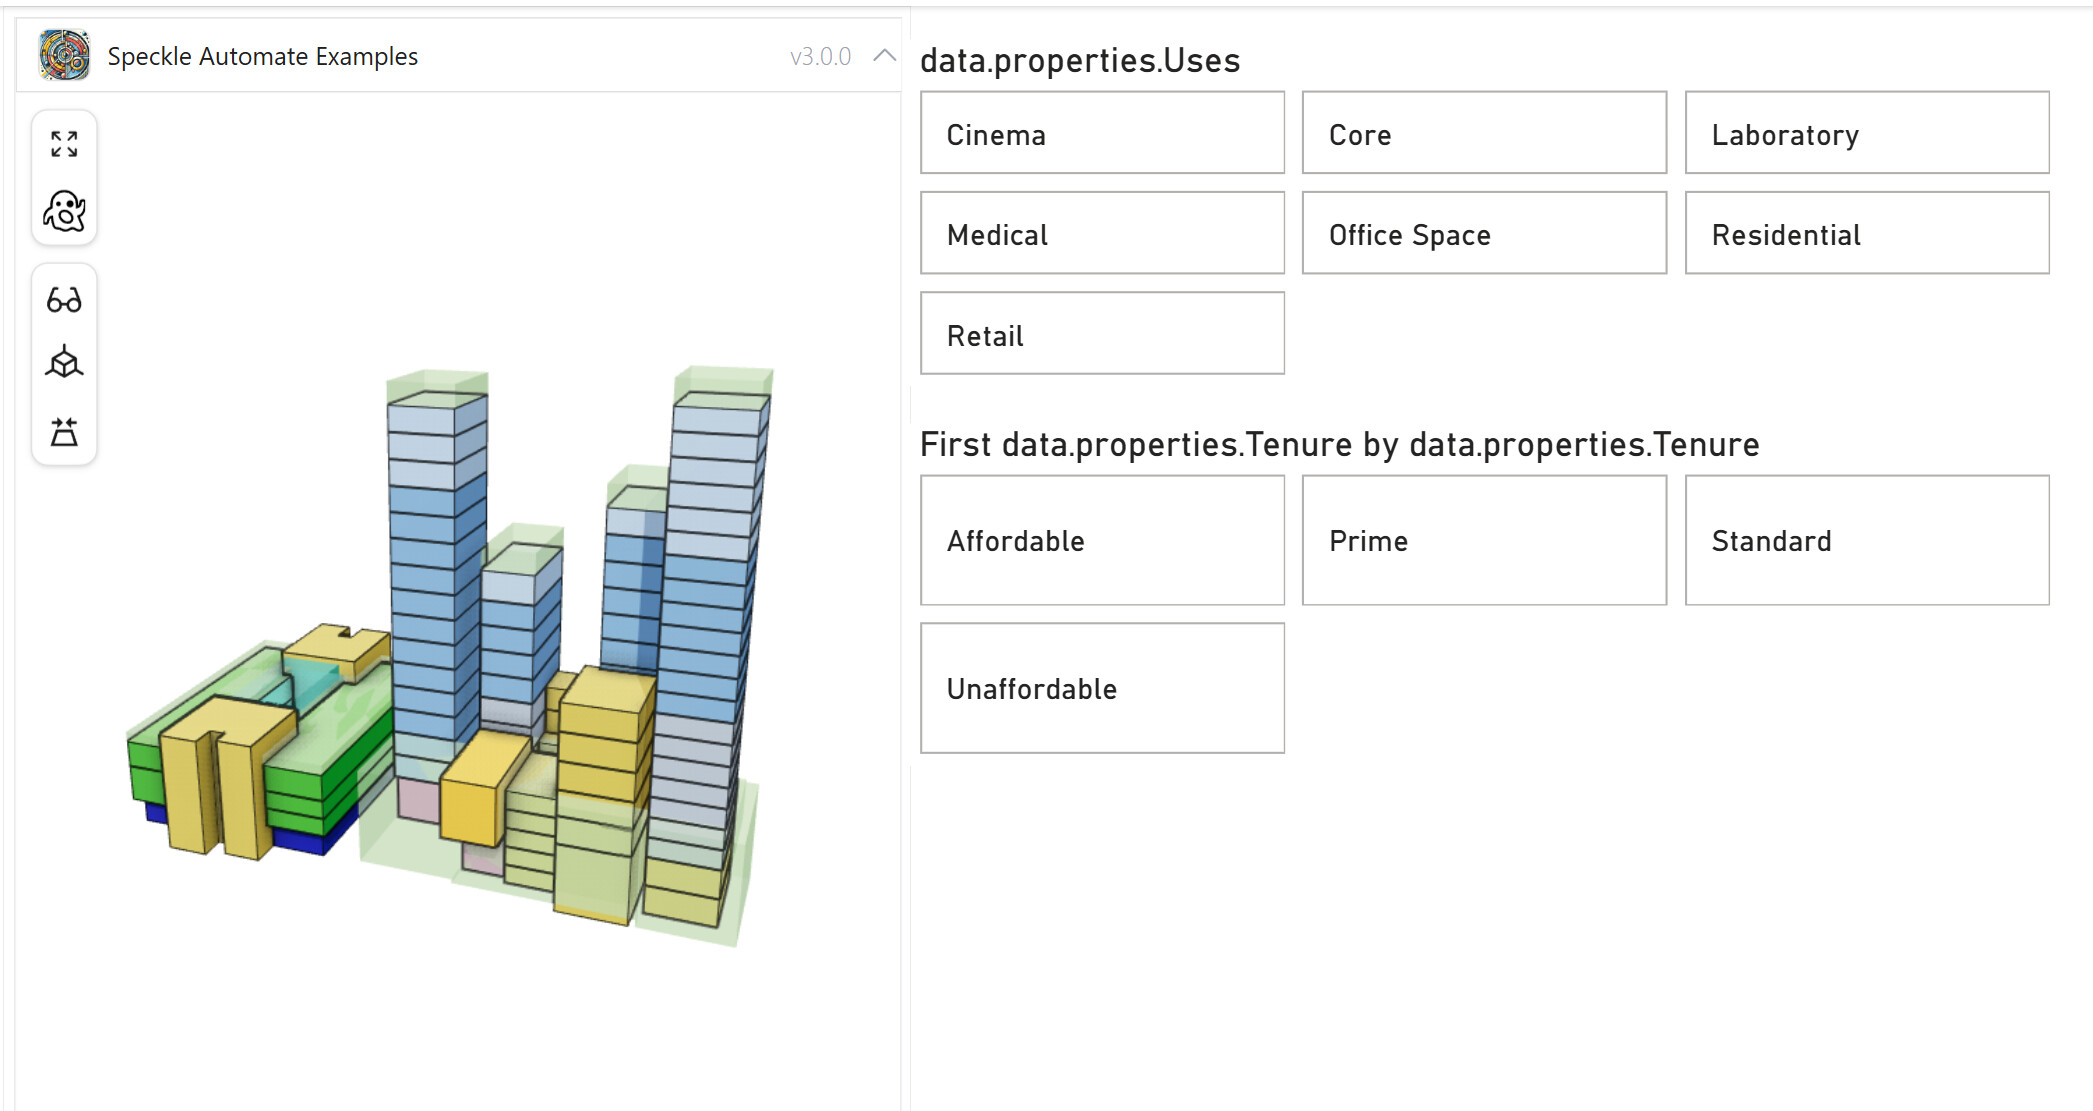
Then further in the PowerBI visual, I add two “Slicers”, one for Uses and one for Tenure. You do this by dragging the data properties revealed in the transformation step.
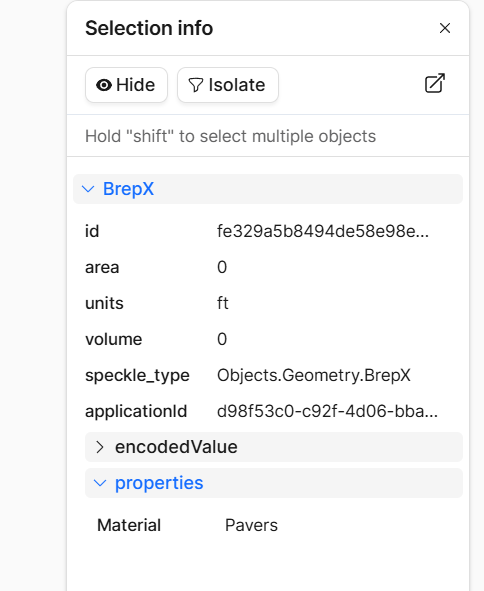
Thanks Jonathan! This is very helpful! however I couldnt find the properties after I reload the model. The properties did show up in the speckle interface but not in power bi. Thanks again!