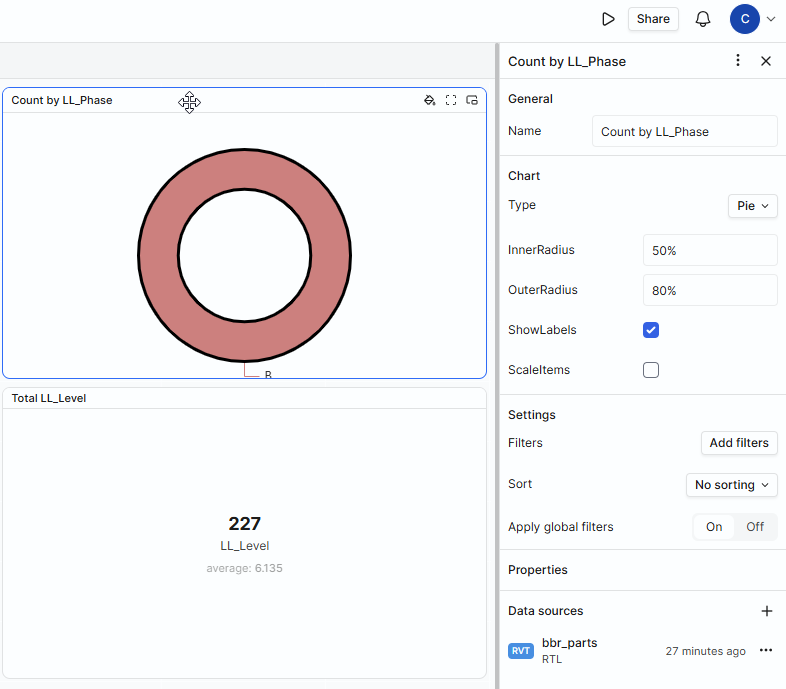
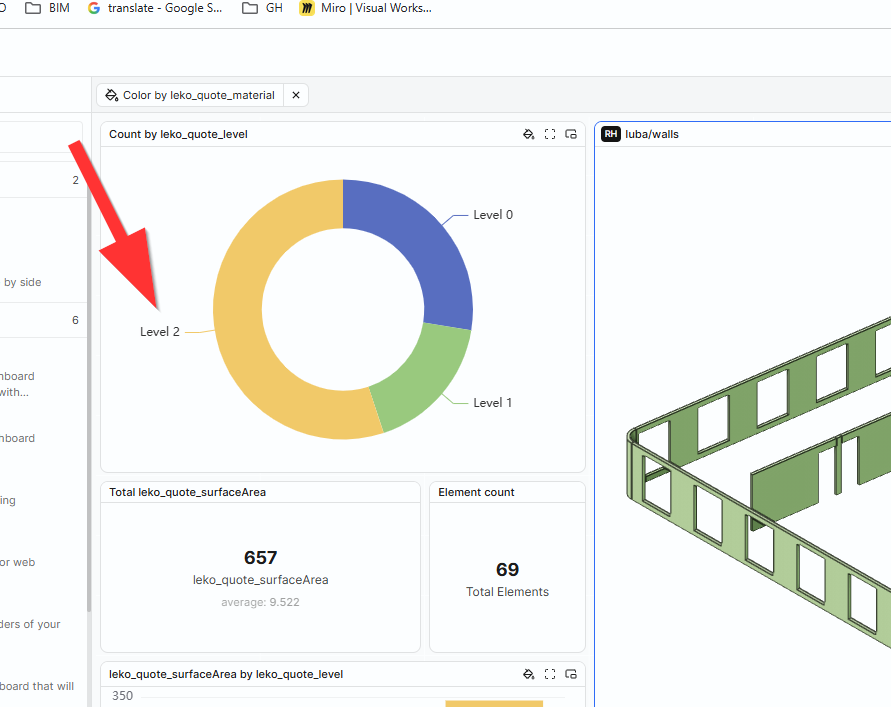
I was curious to know what determines the widget option behaviour. For example, below I have a user-created instance parameter (Revit – Text) with more chart type options available:
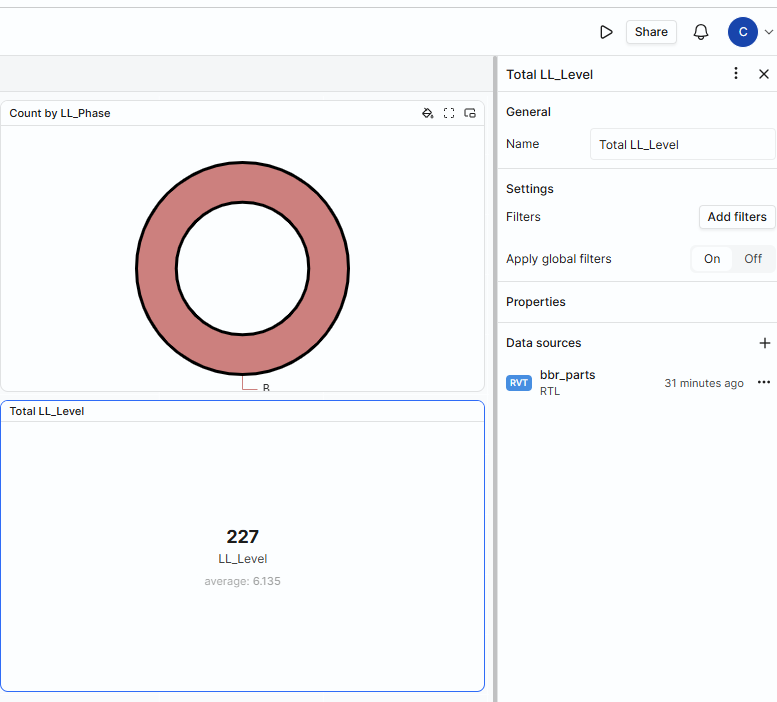
I assume this is related to the parameter type (integer, text, etc.), but is there any way to enable all chart types? For example, for LL_Level (Revit – Other), it would be useful to have access to the additional chart options.
What a actually mean, is that I couldn’t chose the chart type, it gave me a count by default.
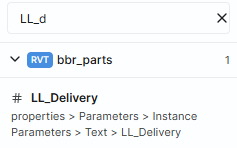
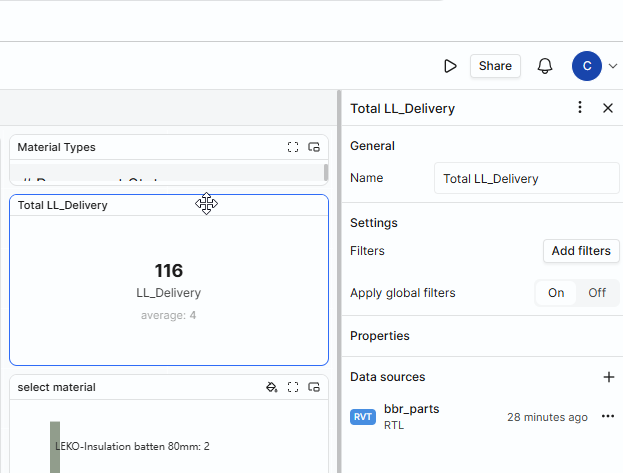
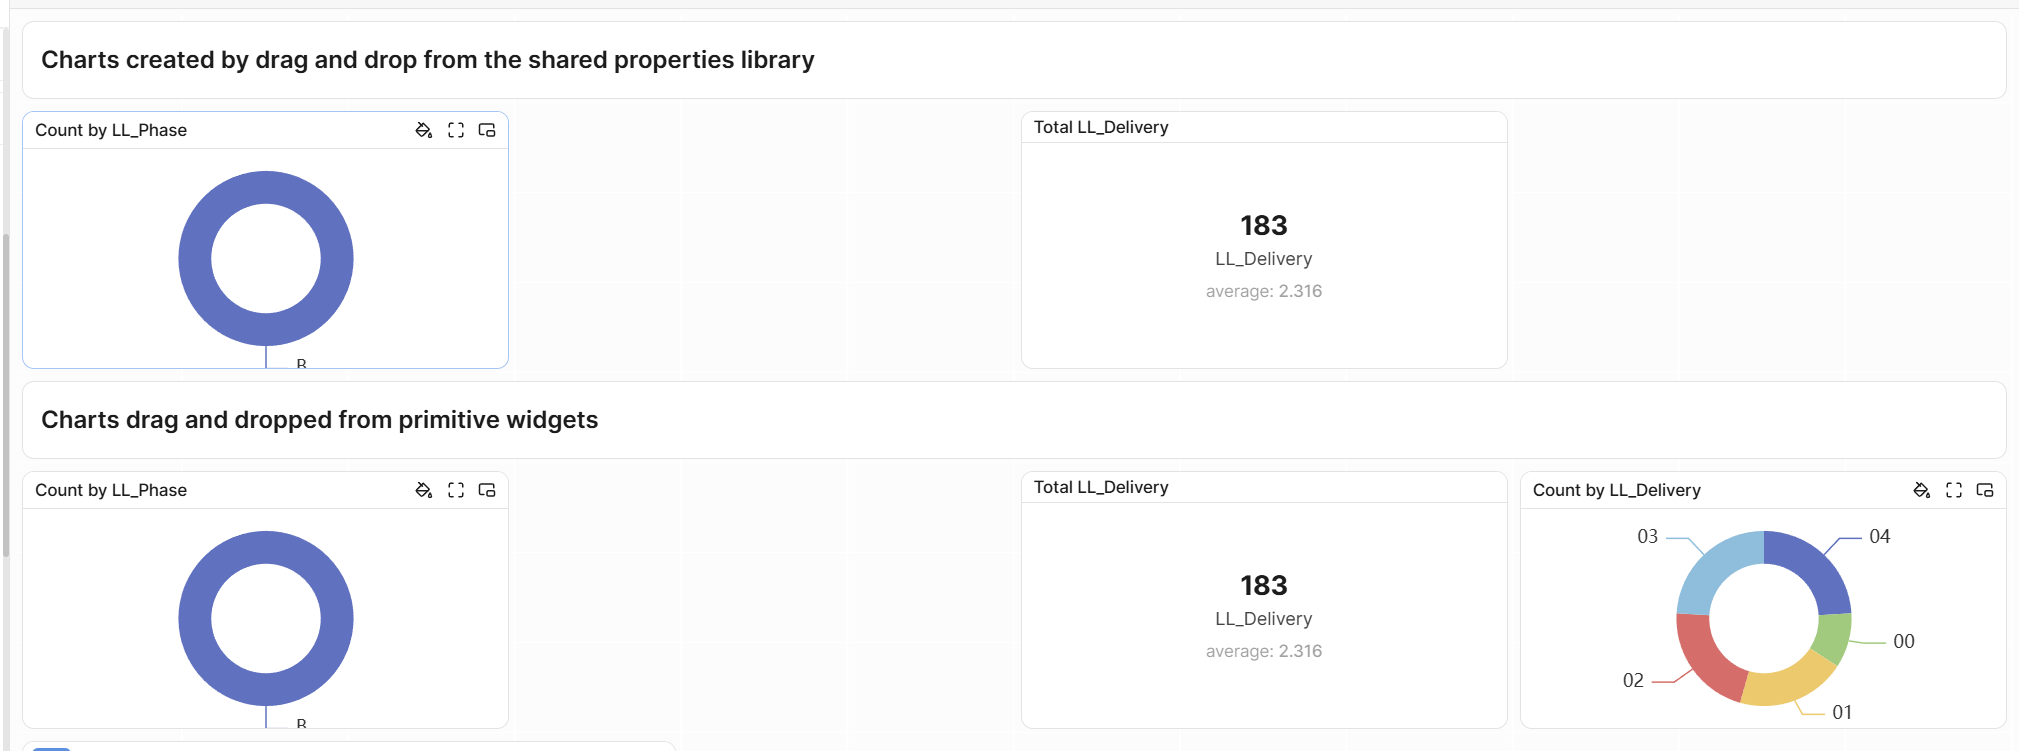
Another example is the below - I have allocated deliveries to certain objects and I would like have more charts options available to visualise the data better.
In both cases, a text/string parameter will not yet perform a conversion to numerical and so can only be the chart types performing counts
The numerical Delivery parameter can be either a total or a count; by default, the properties library uses a total. We don’t currently have a mechanism to switch to a different chart primitive once it’s mounted on the dashboard.
I’ll consider this a feature request - the pivot table widgets perform string to numeric in a reliable, on-demand manner.
Reviving this point quickly, just in case there might be another way to approach it
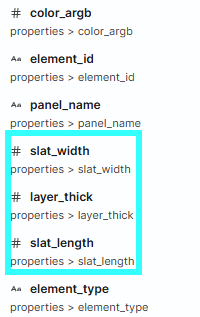
Is there 100% no way that we could be able to expose the values from # type parameters when selecting from the property library? At the moment it seems like we may need to handle this in Power BI, but it would be really useful to be able to do it directly, and we’d like to keep this simple.
For example, slat_width contains values like 30 and 40, and ideally I’d like to select one of those values in a widget (pie, bar chart, etc.) and then see the corresponding slat_length values for that selected width.
If this isn’t possible at the moment, is there somewhere we can upvote or track this feature? It would be a really helpful one for us, so it would be great to follow along if it ends up on the roadmap.
As explained above you can choose the chart type first and then select the property; so the charting you want is 100% possible - just not as a drag and drop from the property library.