Hey Community 
It’s been a busy couple of months on Bashboards, and we’ve shipped a lot, from a completely new calculated fields engine to performance leaps in the viewer, plus two new widget types and a whole batch of quality-of-life improvements. Here’s what’s landed since our last post on May 4th.
 Calculated Fields (Public Beta) — compute new properties without touching your model
This is the biggest thing we’ve shipped in a while. Calculated Fields lets you define synthetic properties that are computed at runtime from your existing model data — no need to change anything in Revit, Grasshopper, or wherever your data lives.
You define a field once, and it appears alongside your native model properties everywhere a property binding is accepted: charts, tables, filters, and viewer colour-by, just like you pick Category or Level.
Fields can be saved at the workspace, project, or dashboard scope, so commonly used calculations (embodied carbon ratios, area-weighted averages, unit conversions) can be shared across all your dashboards or kept local.
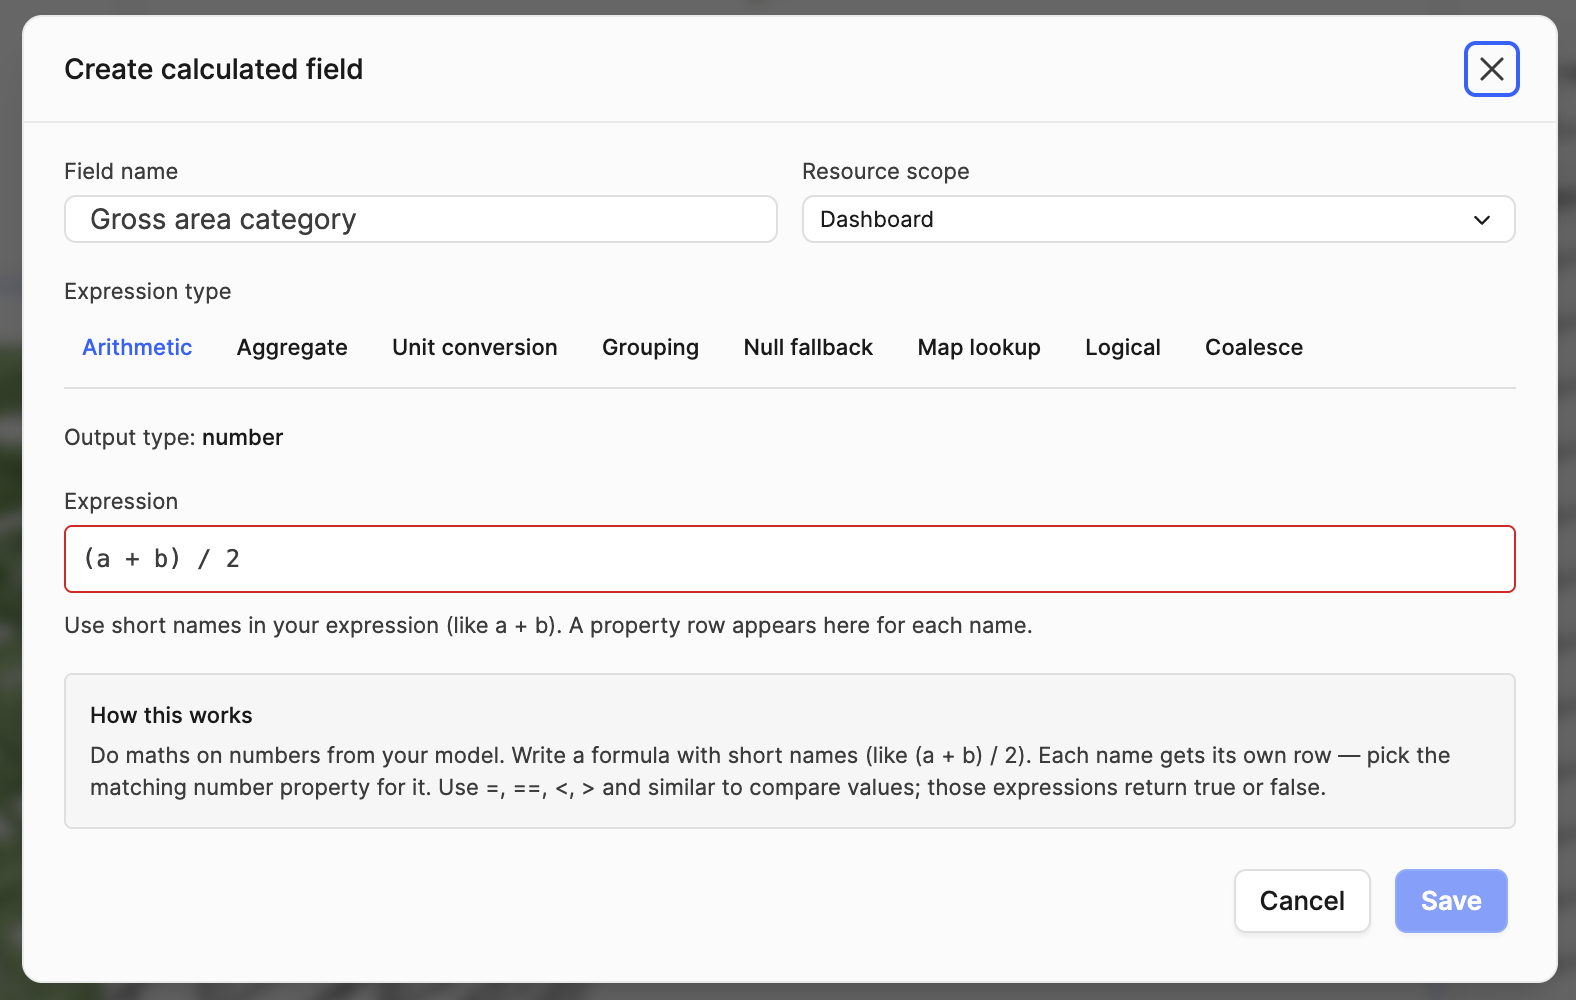
Expression types available today:
- Arithmetic — math formula with named variable bindings to model properties
- Aggregate — sum, average, count, min, max, median across all objects or a filtered subset
- Unit conversion — scale a numeric property by a fixed factor with an output unit label
- Grouping — classify objects into labelled bands (numeric ranges, or text value groups)
- Boolean flag / Logical — pass/fail a set of filter rules, output as custom string labels
- Map lookup — drive mappings from a Lookup Table
- Coalesce — return the first non-null value across a list of paths
- Null fallback — replace nulls with a fixed value
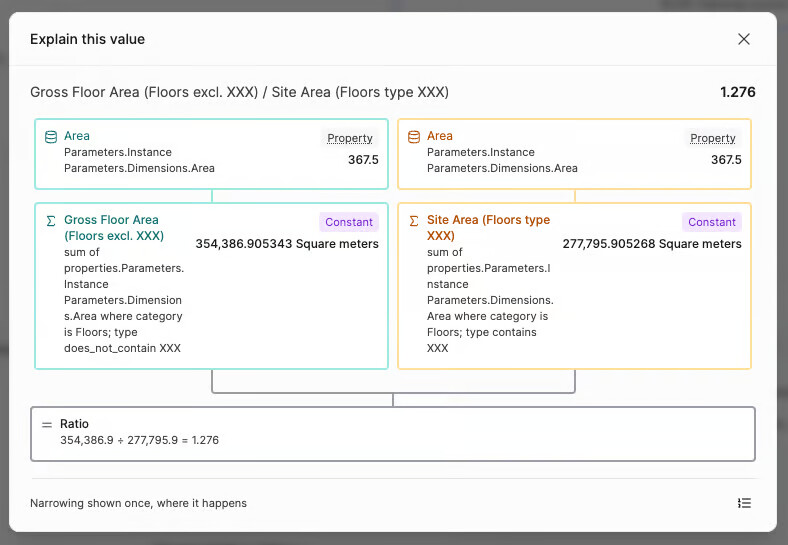
We also added Dashboard constants — aggregate fields that produce a single dashboard-level number (e.g., total GFA) rather than applying the same value to every object. Use them as stable denominators in a Ratio widget, or to combine totals across multiple models. See the Dashboard constants section for the full walkthrough.
 Design Explorer (Public Beta)
The Design Explorer widget is now in public beta. It’s built for Grasshopper workflows where you’re generating and evaluating multiple design options — connect your Grasshopper model, pick the numeric metrics you want to compare, and get a parallel coordinates chart that lets you filter across multiple axes simultaneously.
Click any axis range to isolate the options that meet your criteria; the viewer updates in sync so you can inspect the geometry of your shortlisted options. Great for early-stage massing, facade optimisation, or structural sizing.
 Design Explorer workflow guide
 Parameter Updater (Public Beta)
The Parameter Updater widget is now in public beta, and we’ve expanded what it can do:
- Now supports Rhino and Civil3D — write parameter values back to Rhino and Civil3D objects (previously Revit-only)
- Add new attributes — no longer limited to updating existing parameters; you can now push entirely new properties onto objects, which then become available on the next sync
If your workflow involves computing a value in a dashboard (say, from a carbon calculation or a validation check) and writing it back to the authoring tool, this is the widget for that.
 Time Series widgets — redesigned module
We’ve reworked the time series widget family into a proper module with dedicated widget types and their own calculation layer:
- Sum by property over time — track a summed numeric property across model versions
- Count by property over time — count grouped elements version-by-version
- Element count over time — simple total element count trend
- Material quantities over time — track material volumes/areas across versions
- Numeric aggregate over time — any aggregate (sum/avg/count/etc) over time
Time series data now resolves via packfile when available, providing a significant improvement in loading speed for large models with many versions.
Intelligence Dashboards overview
 Numeric Gradient Range widget
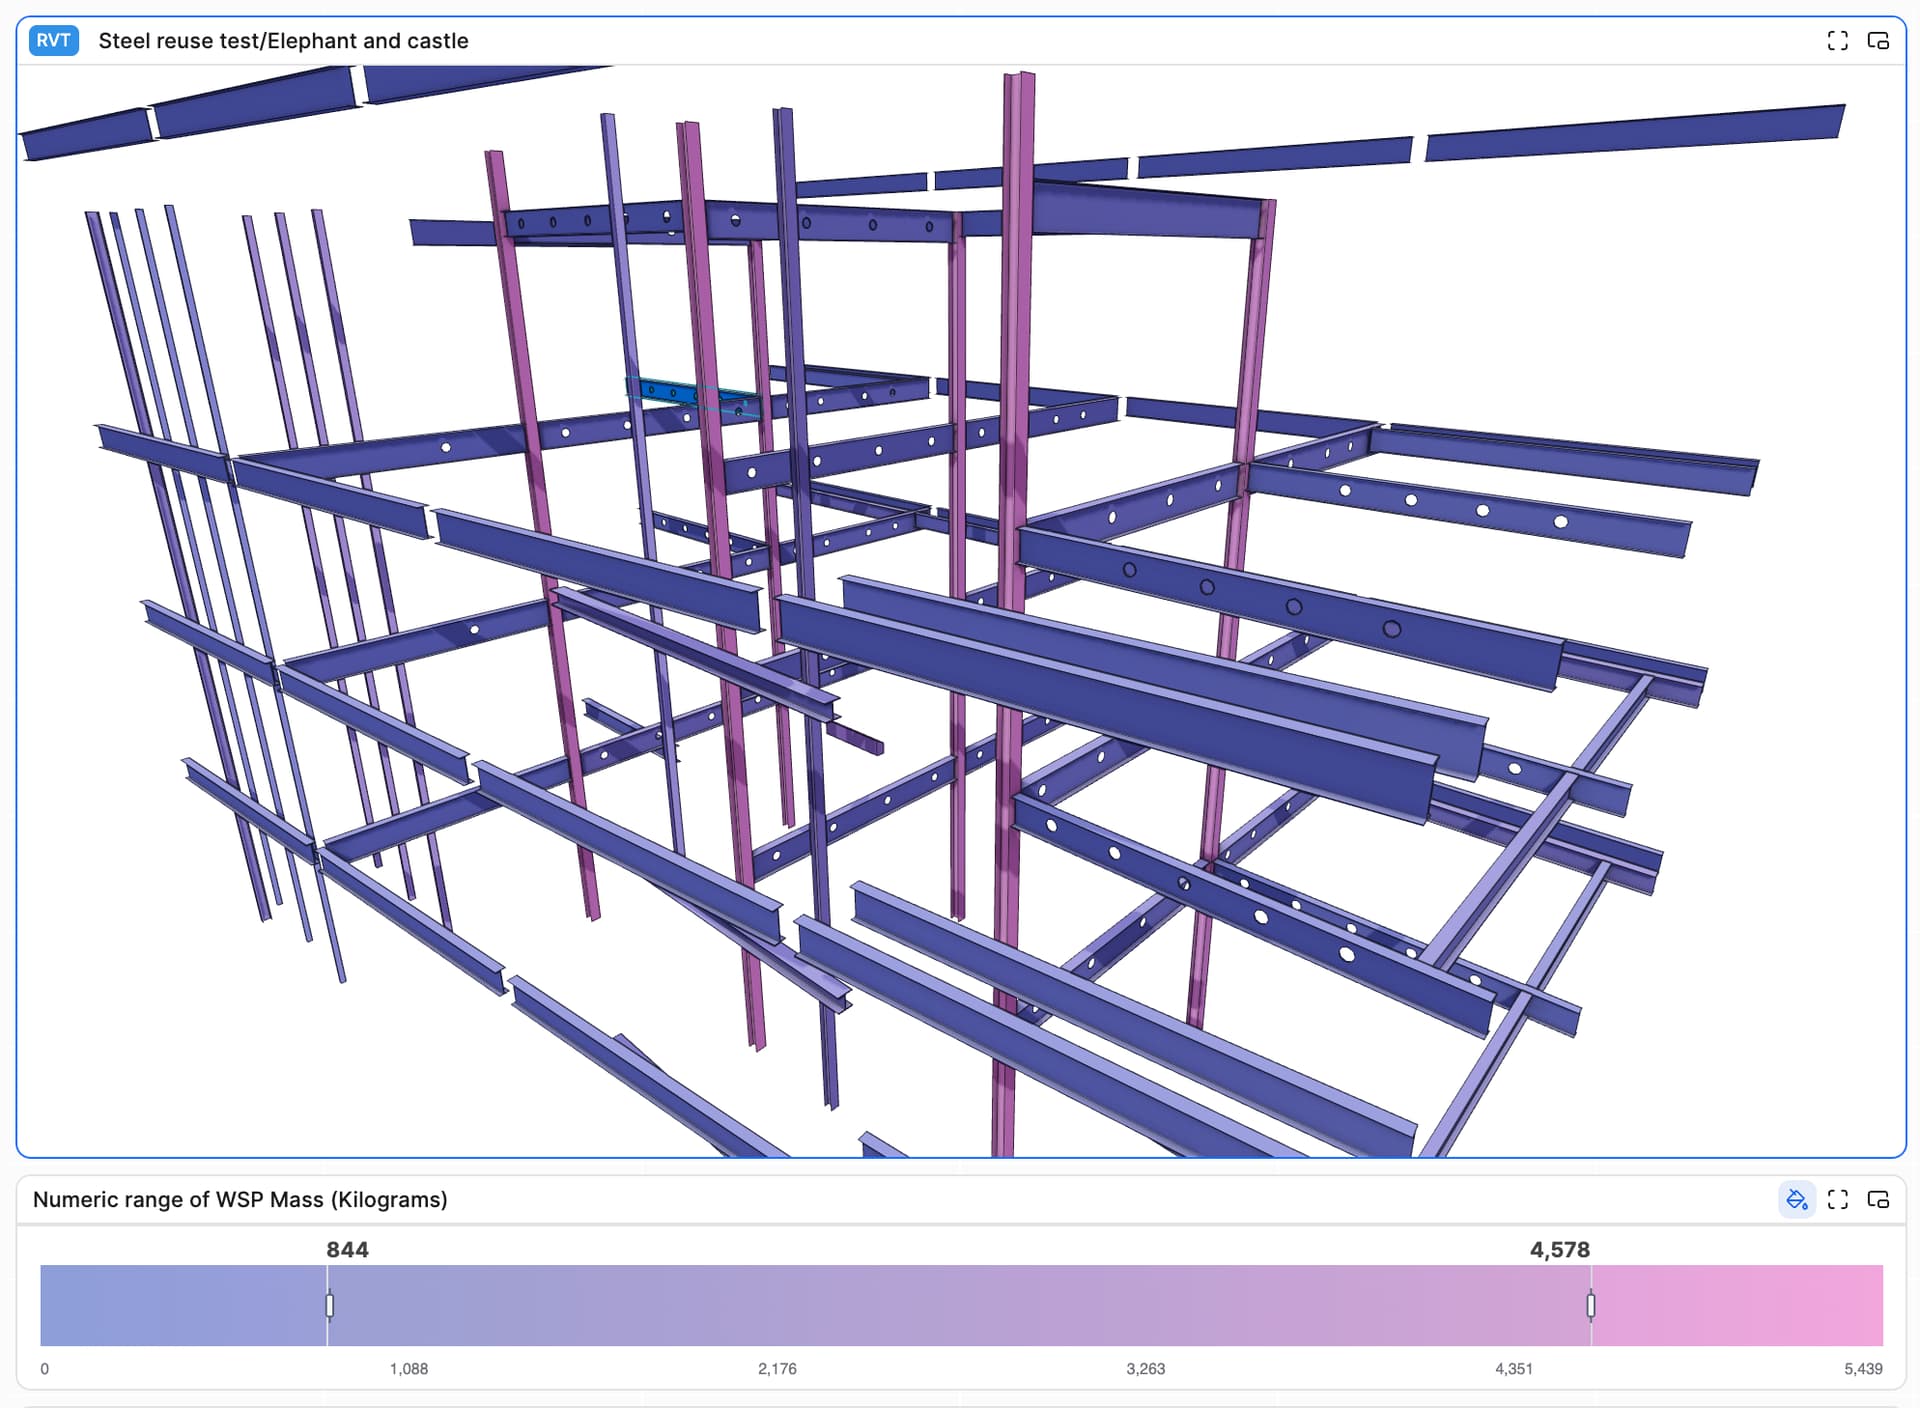
New widget that maps a continuous numeric property to a colour gradient and applies that colouring to objects in the connected viewer. Useful for visualising anything on a spectrum — floor-to-floor heights, structural utilisation ratios, embodied carbon by element, thermal performance metrics, and so on.
 Viewer: colour objects by calculated field
The viewer’s colour-by system now works with Calculated Fields. Any field you’ve defined — derived metrics like carbon intensity per m², or flag-based pass/fail outputs — can be used to colour your 3D model directly. Combine this with the Numeric Gradient Range widget or the standard group-by colouring for richer visual analysis.
 Context models — visual exclusivity
When you load a model as a context model in the viewer (for spatial reference only), it is now fully exempt from dashboard filter slices. Previously, filtering by a chart value could inadvertently ghost out your context geometry. Now, context models remain fully visible regardless of which filters are active on the analytical models.
See the Context models section of the dashboards overview.
 Lookup Tables (Beta) — expanded scope and management
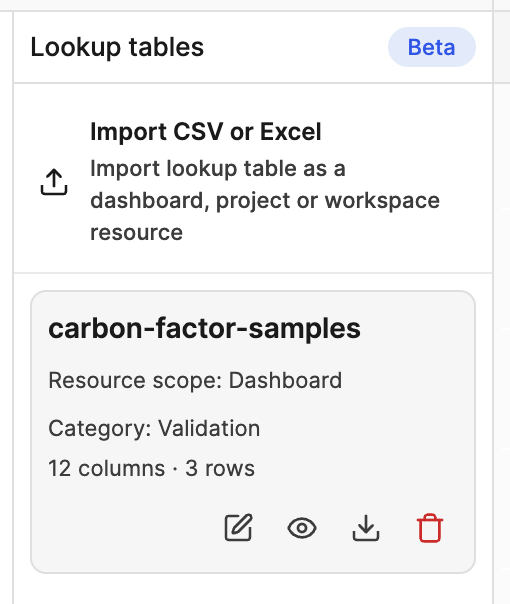
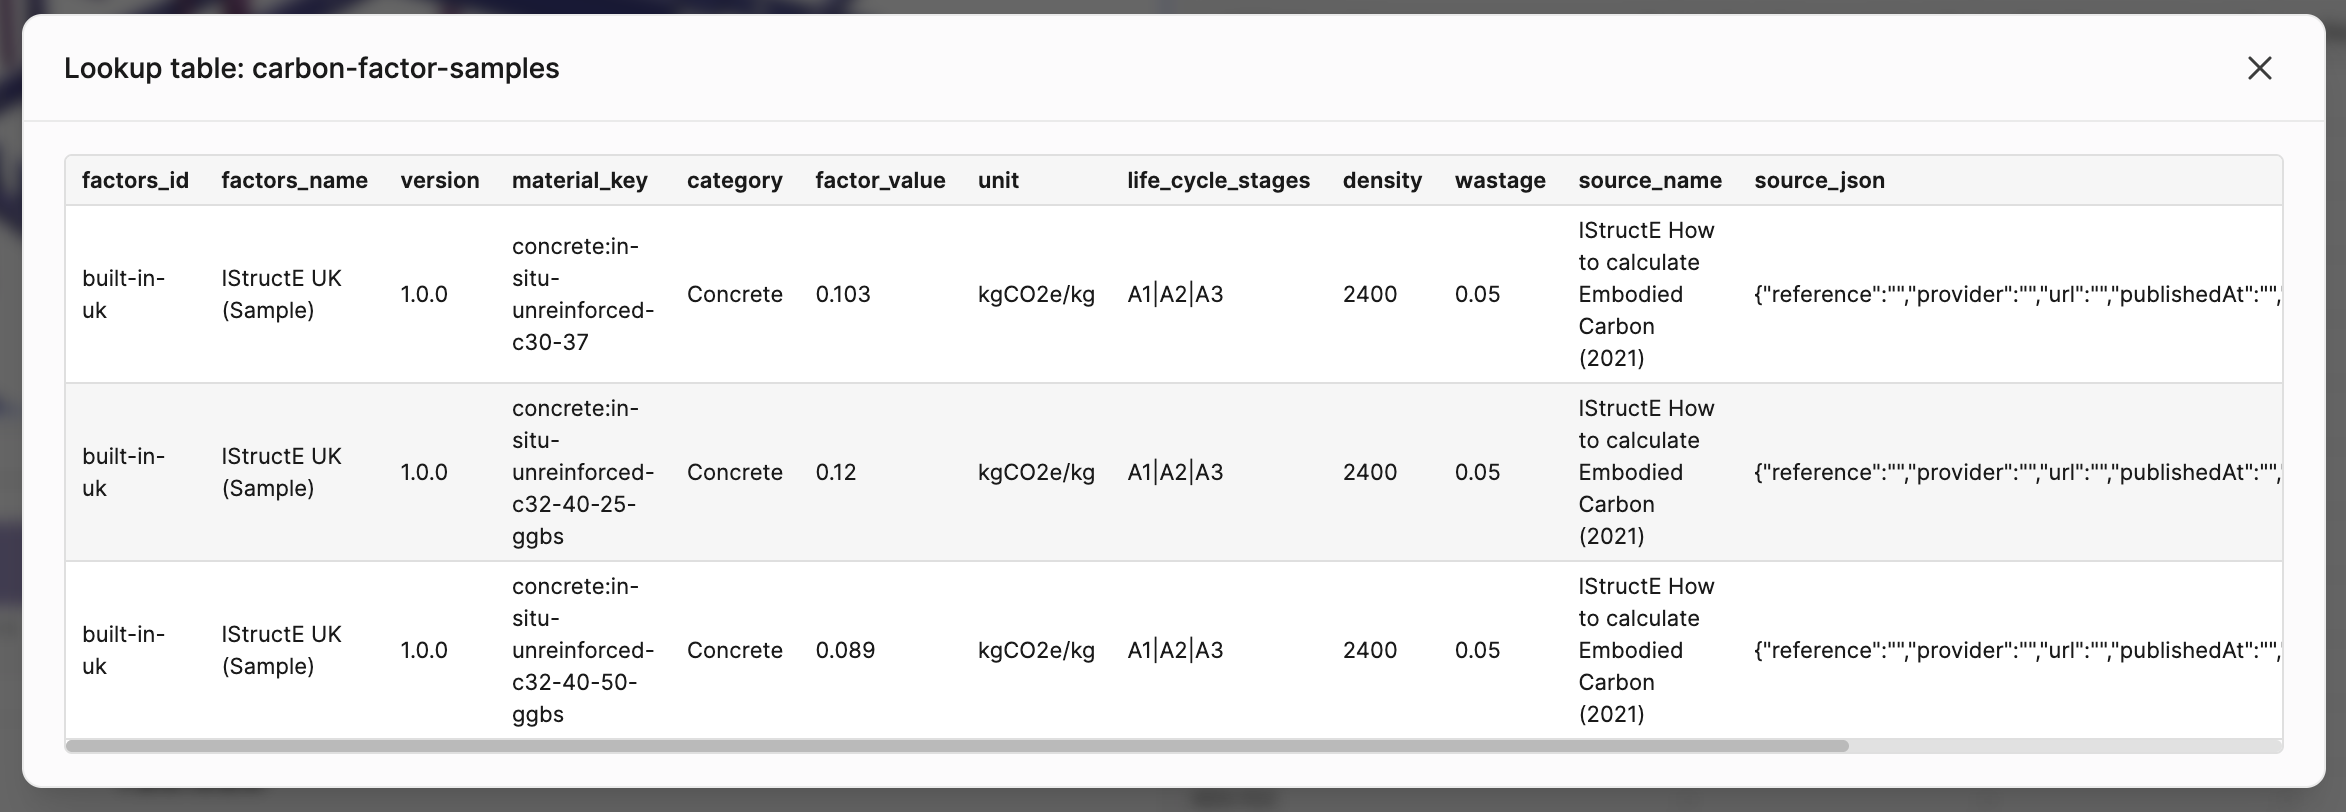
Lookup Tables — the shared reference data library for validation rules and calculated field mappings — now supports dashboard scope in addition to workspace and project. Import a CSV or Excel file that’s local to a single dashboard without touching the shared workspace library. We’ve also improved the collection management UI and fixed CSV parsing for edge cases.
 Model Validation — new predicates and conditions
Continuous Data Validation is where our attention falls these days, but for those of you with existing validation dashboard workflows, you are not forgotten - that said, we will likely sunset this feature in time.
In the meantime a set of improvements to the validation widget rule engine:
count_at_mostandcount_at_leastpredicates — validate that no more than (or at least) N elements match a condition per group- External lookup tables in validation rules — rule conditions can pull their allowed-value lists from a named column in a Lookup Table, so approved material lists or category allowlists live in one place and are referenced across multiple rulesets
- Advanced condition handling — more complex multi-condition rule logic with better human-readable message generation
- Fixed: commas in “one of” predicates — a regression that broke comma-separated values in
one ofrules has been fixed
 Faster loading across the board
- 3D geometry loads noticeably faster — the viewer now uses the faster loading path by default for recent model versions. For most Revit models, you should see geometry appear significantly sooner than before.
- Charts appear before all data has finished loading — property data for each data source now loads independently in the background. Rather than waiting for every source to finish, chart widgets start showing results as soon as their data is ready. A readiness indicator tells you when sources are still resolving.
- Complex dashboards feel more responsive — widgets now skip unnecessary redraws when their underlying data hasn’t actually changed, which reduces jank on dashboards with many widgets and large models.
- Time series dashboards load faster — time series widgets now use the same faster loading path as the viewer when your model versions support it.
 Fixes
Fixes
- Dashboards with deleted sources now open correctly — previously, if a model you’d connected to a viewer widget had been removed from the project, the whole dashboard could fail to load. It now opens and shows the remaining widgets normally.
- Custom widget titles are no longer reset — widgets that auto-generate titles from their configuration were overwriting custom titles you’d set. Your names now stick.
- Filtering no longer affects context models — chart filters and slices were inadvertently ghosting geometry that was loaded as a context/reference model. Context models now stay fully visible regardless of what filters are active. (This was also called out above under Context models — noting it here too since it was a visible regression.)
- Carbon assessment and lookup tables now work at dashboard scope — these features weren’t recognising dashboard as a valid scope, which caused data to fail to load in some configurations.
- Switching model versions no longer leaves ghost geometry — swapping to a different version in the viewer could leave stale geometry from the previous version visible alongside the new one.
 What’s new in the docs
- Calculated Fields — full reference including all expression types, scope, constants, and things to watch out for
- Lookup Tables — import formats, scope levels, and usage in both validation and calculated fields
- Validation Widgets — updated to cover new predicates, lookup-backed rules, and improved condition handling
- Parameter Updater — full setup guide with images, Rhino support, and new attribute creation
- Design Explorer workflow — end-to-end guide from Grasshopper tagging through to reading results
- Data validation results — guide and example notebook for working with validation output programmatically
- Context models — how to configure them and what exemptions apply to filters and slices
- Common workflows — new walkthroughs: share-of-whole with Aggregate + Arithmetic; X-per-Y across two models using constants; codes to clear labels with Map lookup
 Thank you
Some of this release was shaped directly by people who took the time to report issues and push for what the product should be able to do.
@hwollersheim (Henrik, Haskoning) — filed a clear, reproducible report showing that total property value widgets displayed inflated numbers on first load, correcting themselves only after opening and closing the filter dialog without changing anything. That described the bug precisely. Fixed.
@Tom.Sargent (WSP) — pushed hard everywhere.
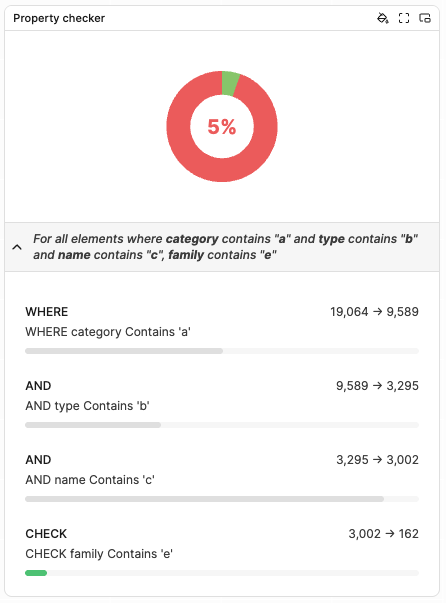
@Neeraj — raised the constraint of only being able to place one checker widget per dashboard and asked about more complex multi-rule configurations in the Property Checker feedback thread. The reworked Model Validation widget handles multiple independent rulesets.
Haskoning @pieter and LMN Architects (Alex) and Laing O’Rourke (Ana Elisa, Ben and @Jeremy — all asked for the ability to load a site or reference model into the viewer without it participating in widget calculations or getting ghosted by filters. Alex put it well: “I’m hoping to upload a site model which shows existing conditions while the design schemes themselves are what I hope to be tabulating on the canvas.” That’s exactly what context models now do.
Gensler (@NaoB and @Maya) — raised the need for gradient colouring based on numeric parameters and for more expressive OR-logic in validation rules. Both shipped this cycle.
WSP (Tom), JTC, KPF (@Klee), and Multiconsult — each independently requested the ability to compute new values from model properties within the dashboard: normalised carbon metrics, rebar ratios, span-to-depth ratios, and unit conversions. Calculated Fields is the answer.
Pomerleau, Turner, Entuitive, Heijmans, and Woods Bagot — flagged data conditioning and parameter write-back as top priorities. Parameter Updater is going to public beta, and the arrival of Calculated Fields is a direct response to the weight of demand, albeit more of a trajectory at this point
All that is to say - thank you. But also, always, always keep letting us know what you are up to, where we fail or where we can grow. The calculated fields engine, in particular, is very new — we’d love to hear which expressions you wish existed, which scoping behaviour doesn’t match your expectations, and what you end up building with it.
— Jonathon & the Intelligence team
 Change a pinned version in place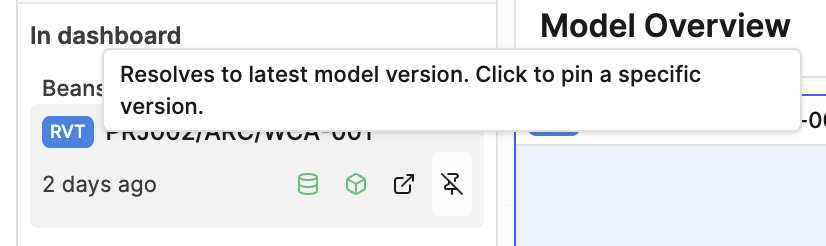
 Switch a widget’s data source in place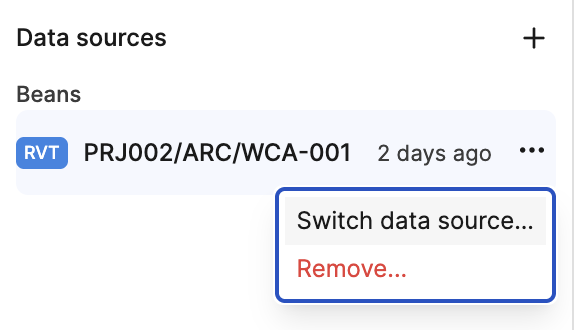
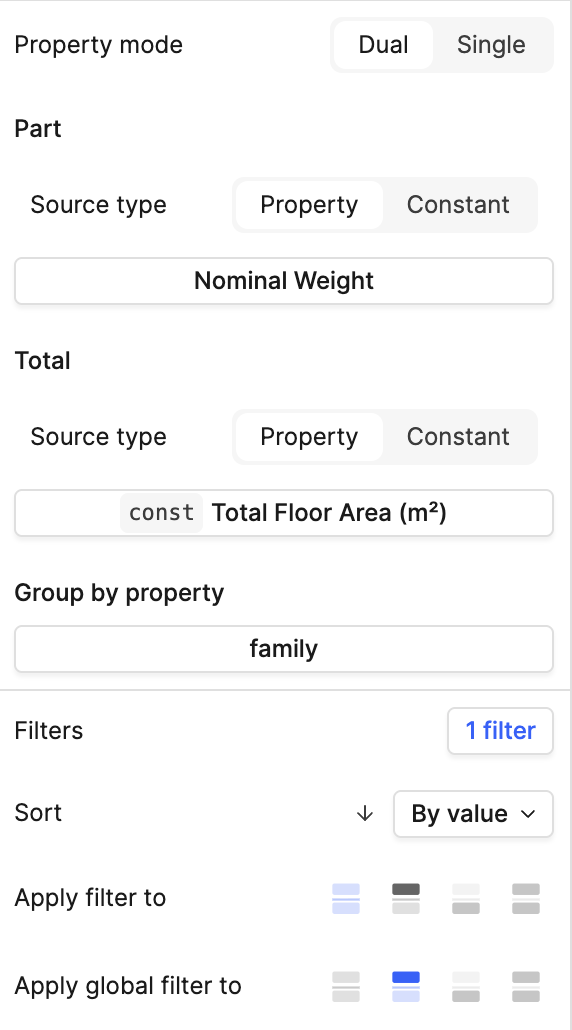
 Dual Viewer modernised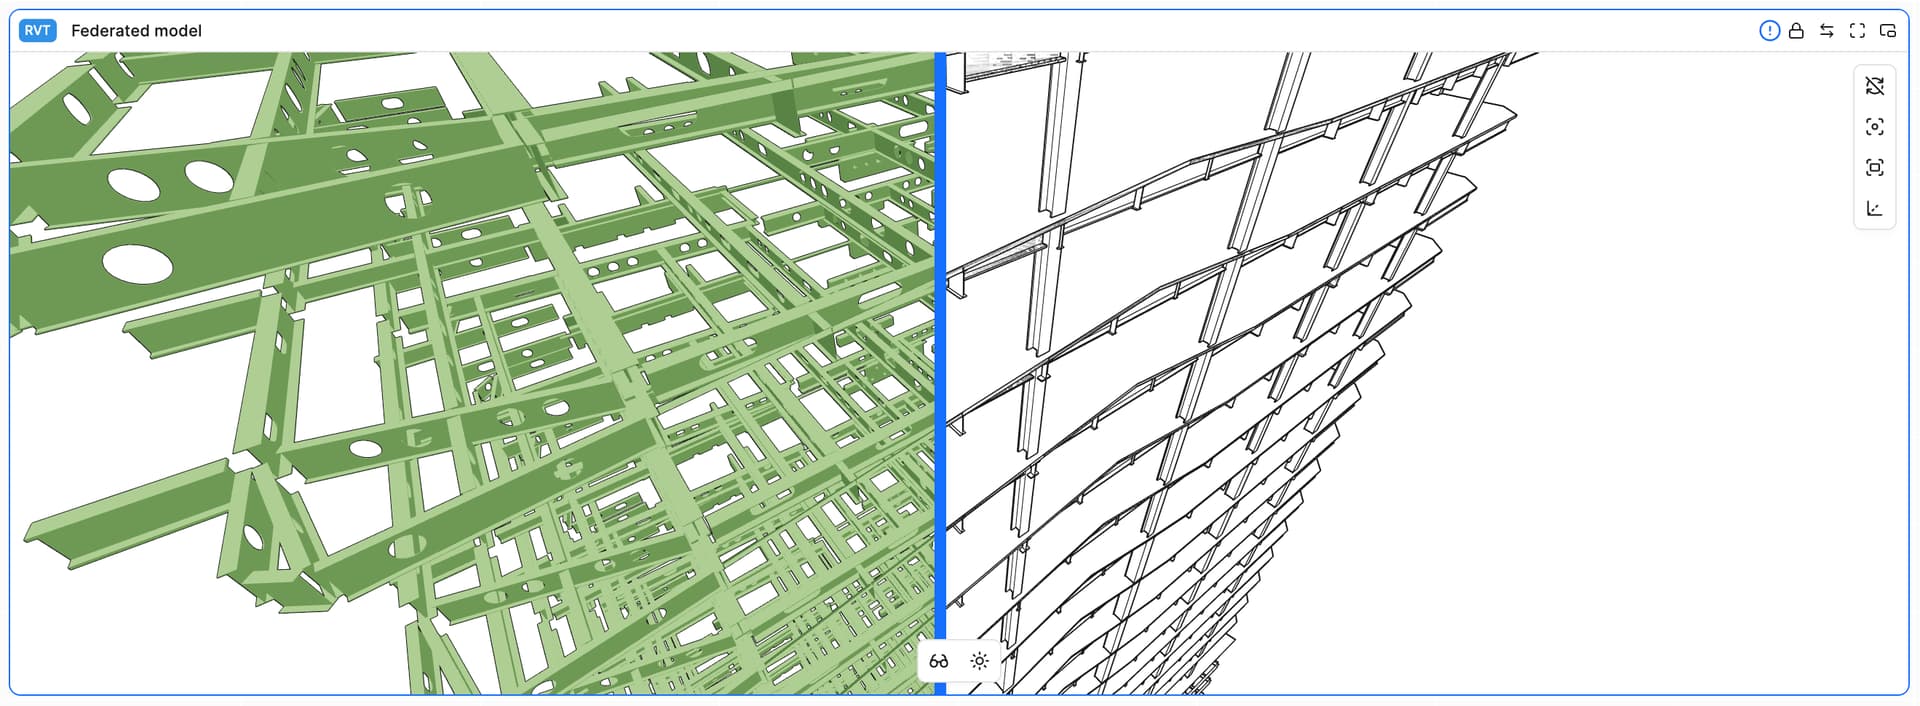
 Smaller fixes worth knowing
 Context widget (beta) — your model on a map
 Workspace & project-scoped colour palettes
 More aggregation options on Total Property widgets