Hi everyone,
I’d like to play a little game called “where is waldo?”
I’m trying to develop a simple dashboard with ALL the materials extracted from revit to PowerBI (Next gen connector from Revit 25 to PowerBI). I remember this is an issue to do with the data structure from Revit, and this tutorial help me a lot, but I still I cannot manage to extract material
Curtain Wall Mullions
Curtain Walls (But I guess it’s ok, since we have them as panels, families or mullions)
Railings (should at list list by category?)
Stairs (Sub elements)
Nested families (e.g. doors windows)
Is there a way to interrogate them in PowerBI, or something you can look into in the next update?
update:
i did some other tests and most of the missing values is because they have’t been assigned at all in the original file. Is there a way to get at least a “null” value in the export?
Eliminating nulls where no property existed was a key factor in v3 connectors becoming 1000% faster.
In a PowerBI context, you should be able to add this into your PowerQuery without the need for the nulls to be there, but would require some hardcoding names of properties on your part.
From your list, extracting materials from railings is currently not possible—but it’s coming very soon, likely in the next release.
For all the other items you mentioned, you should already be able to extract the materials. If you share a model URL with us, I’d be happy to help you extract them.
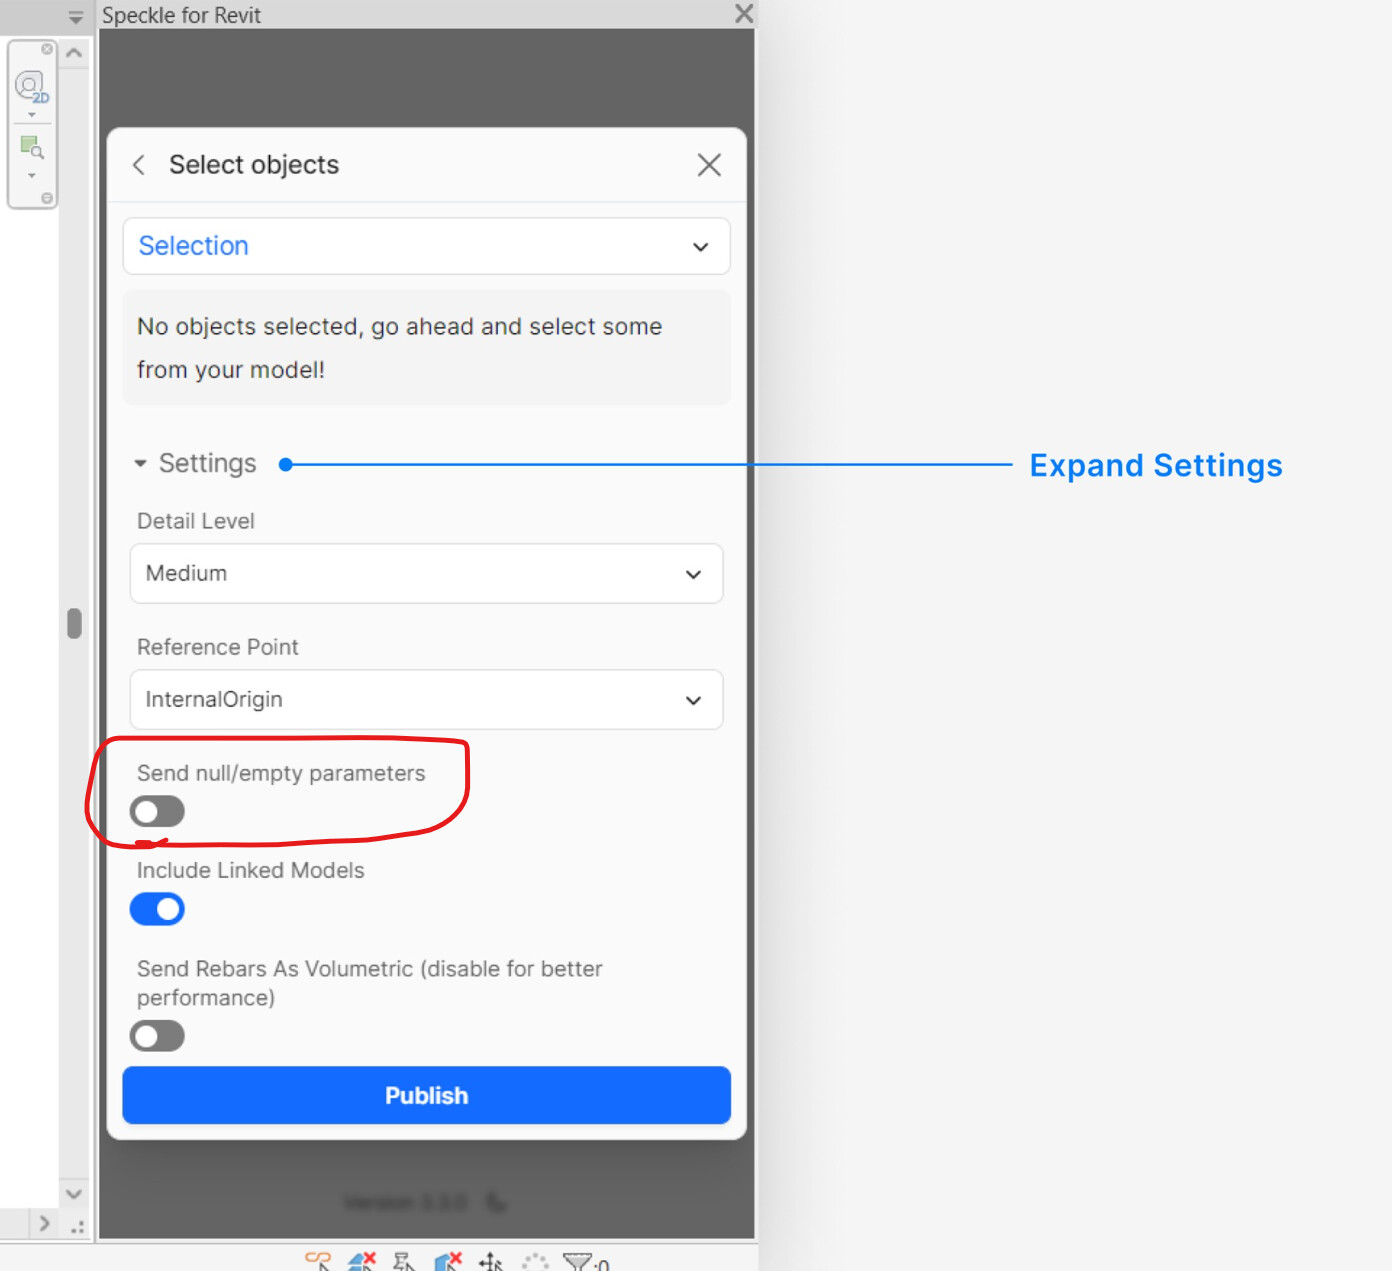
Additionally, to build on what Jonathon mentioned: by default, the “send” operation excludes null values to improve performance. However, if you’d like to include null value, such as when linking external data, you can enable the “Send null parameters” option in the connector settings.
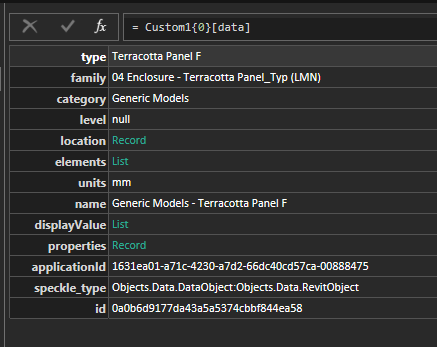
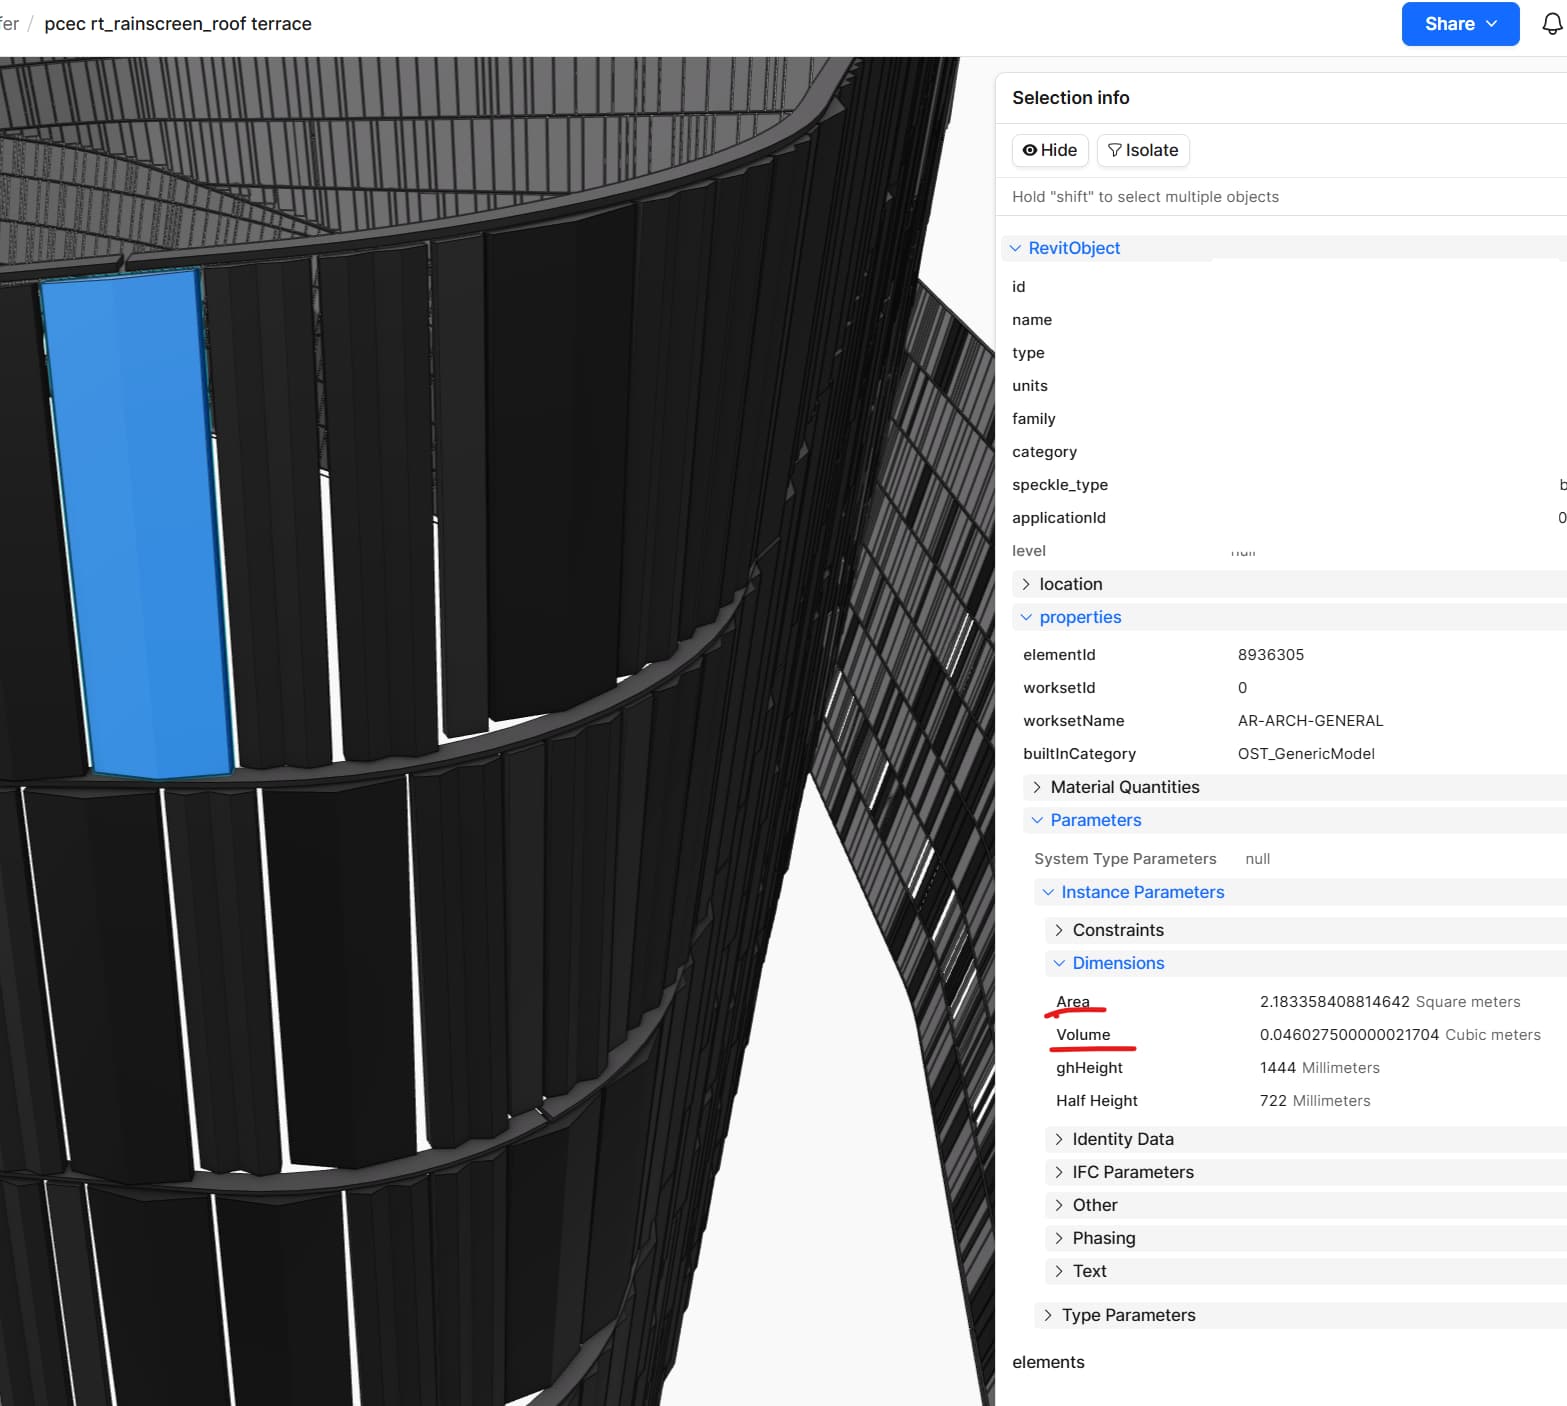
I’m having a similar issue where I’m sending Revit families across to Power BI, but unable to extract parameters from the data for visualization. The 3D viewer works great (thanks for this!) but the accompanying data (things like type, family, dimensions, volume, material/finish, etc), while visible when examining the record, cannot be individually extracted for viewing in Power BI. (Perhaps this is a Power BI problem and not Speckle…)
Here is a link to a reference Speckle upload which has the geometry (one Generic Model family with six types, populated ~6,000 times in the model).
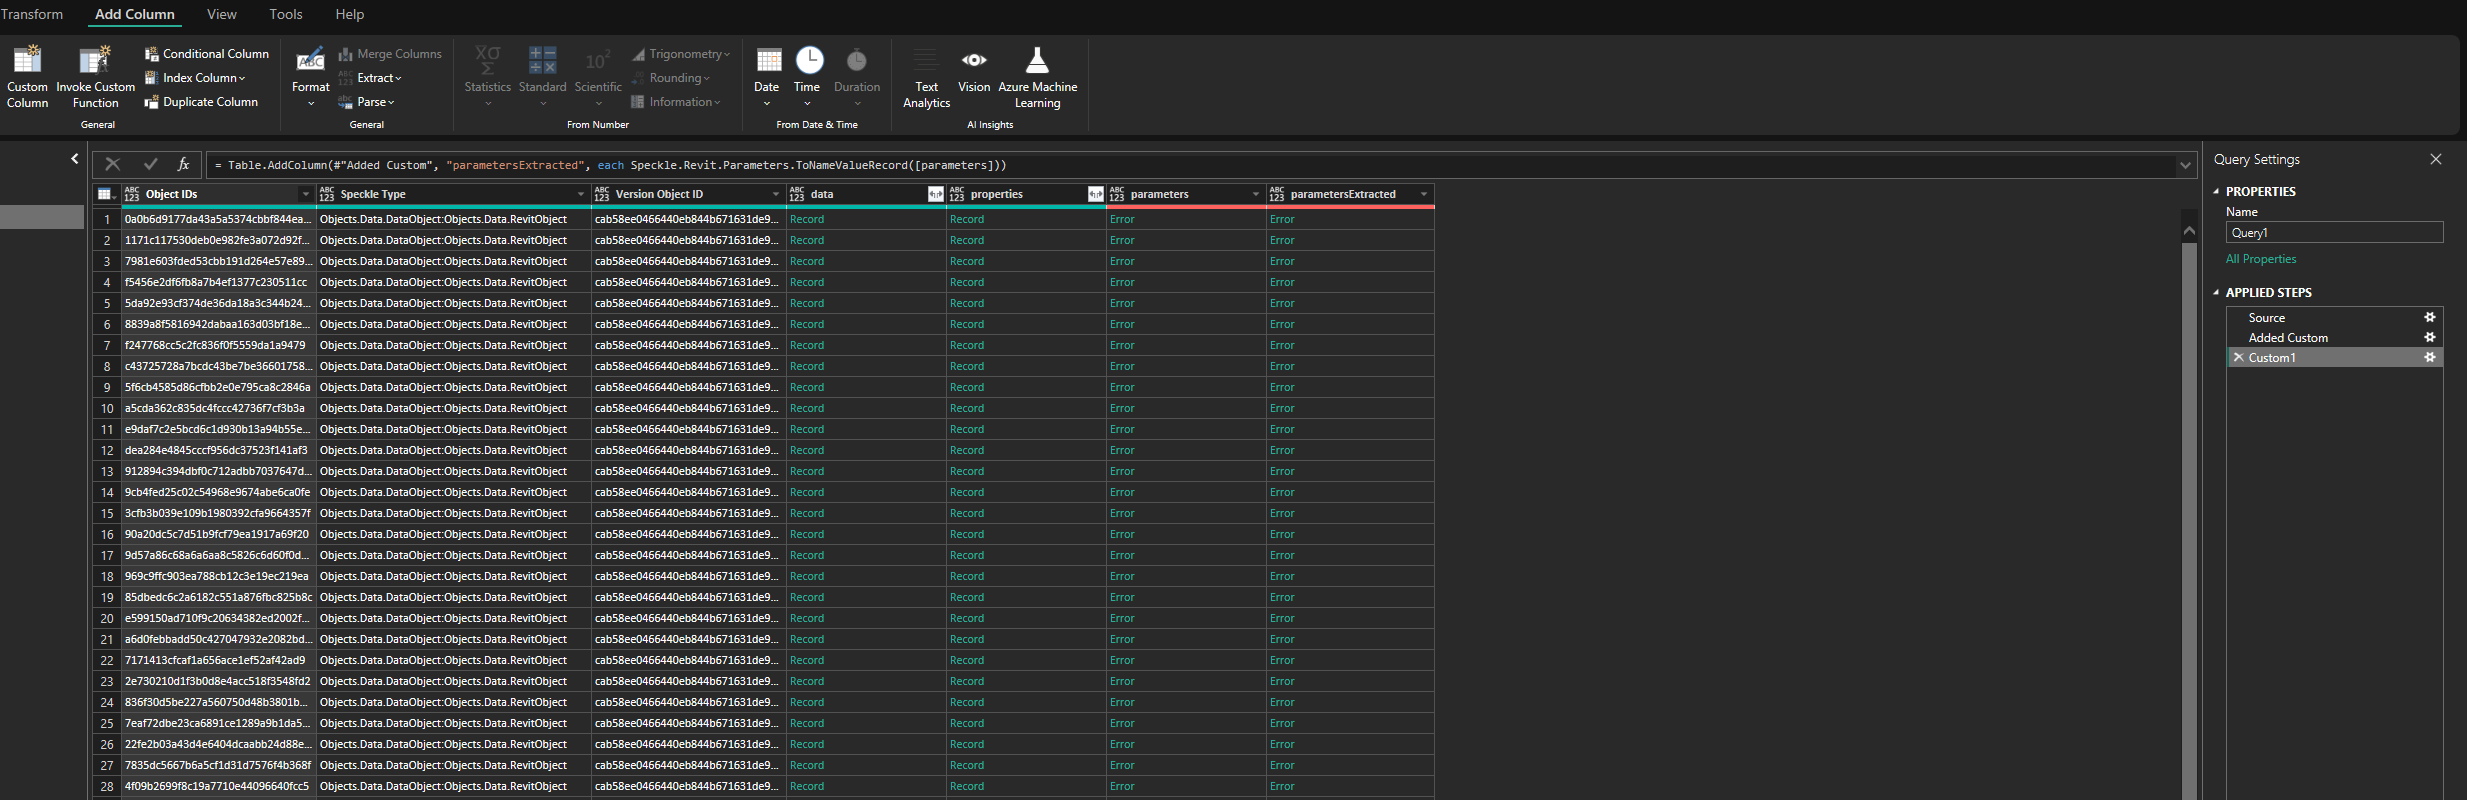
As you can see in the snip below, in trying to read the included parameters (which include the Type and Family), I’m getting an “Error” in the respective columns instead of “Record” inputs.
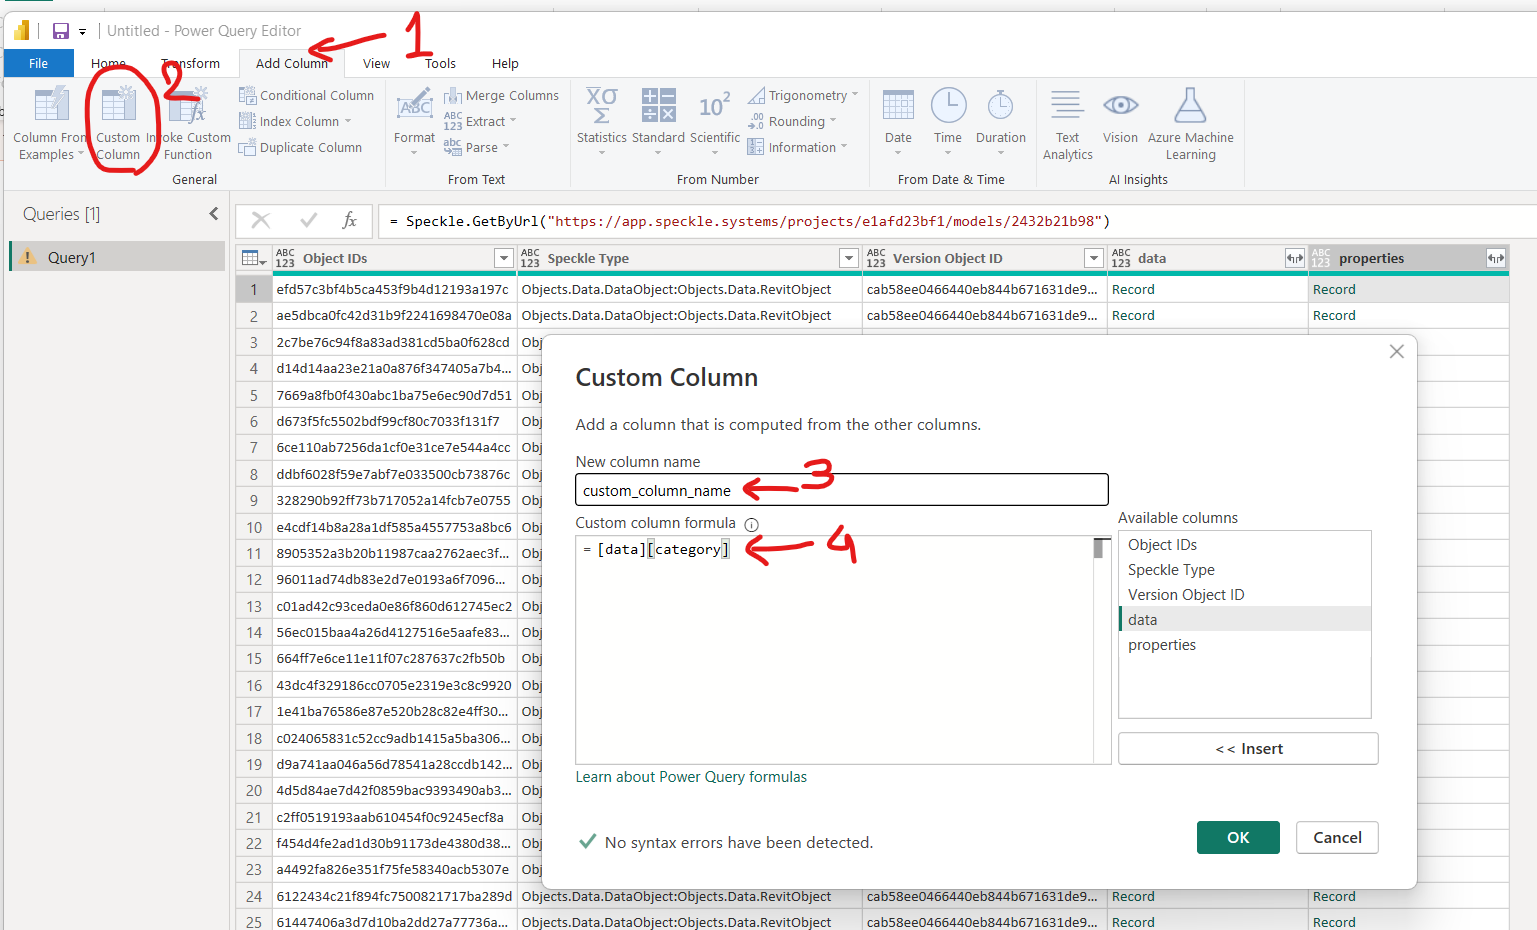
As you said this is more how to extract parameters PowerBI issue. Here is a quick guide of how to do it:
1__ Add custom column - from the [data] record you can extract directly parameters to a new column like type, family, category, level, name etc… - it’s type sensitive so make sure to write the parameter key correctly.
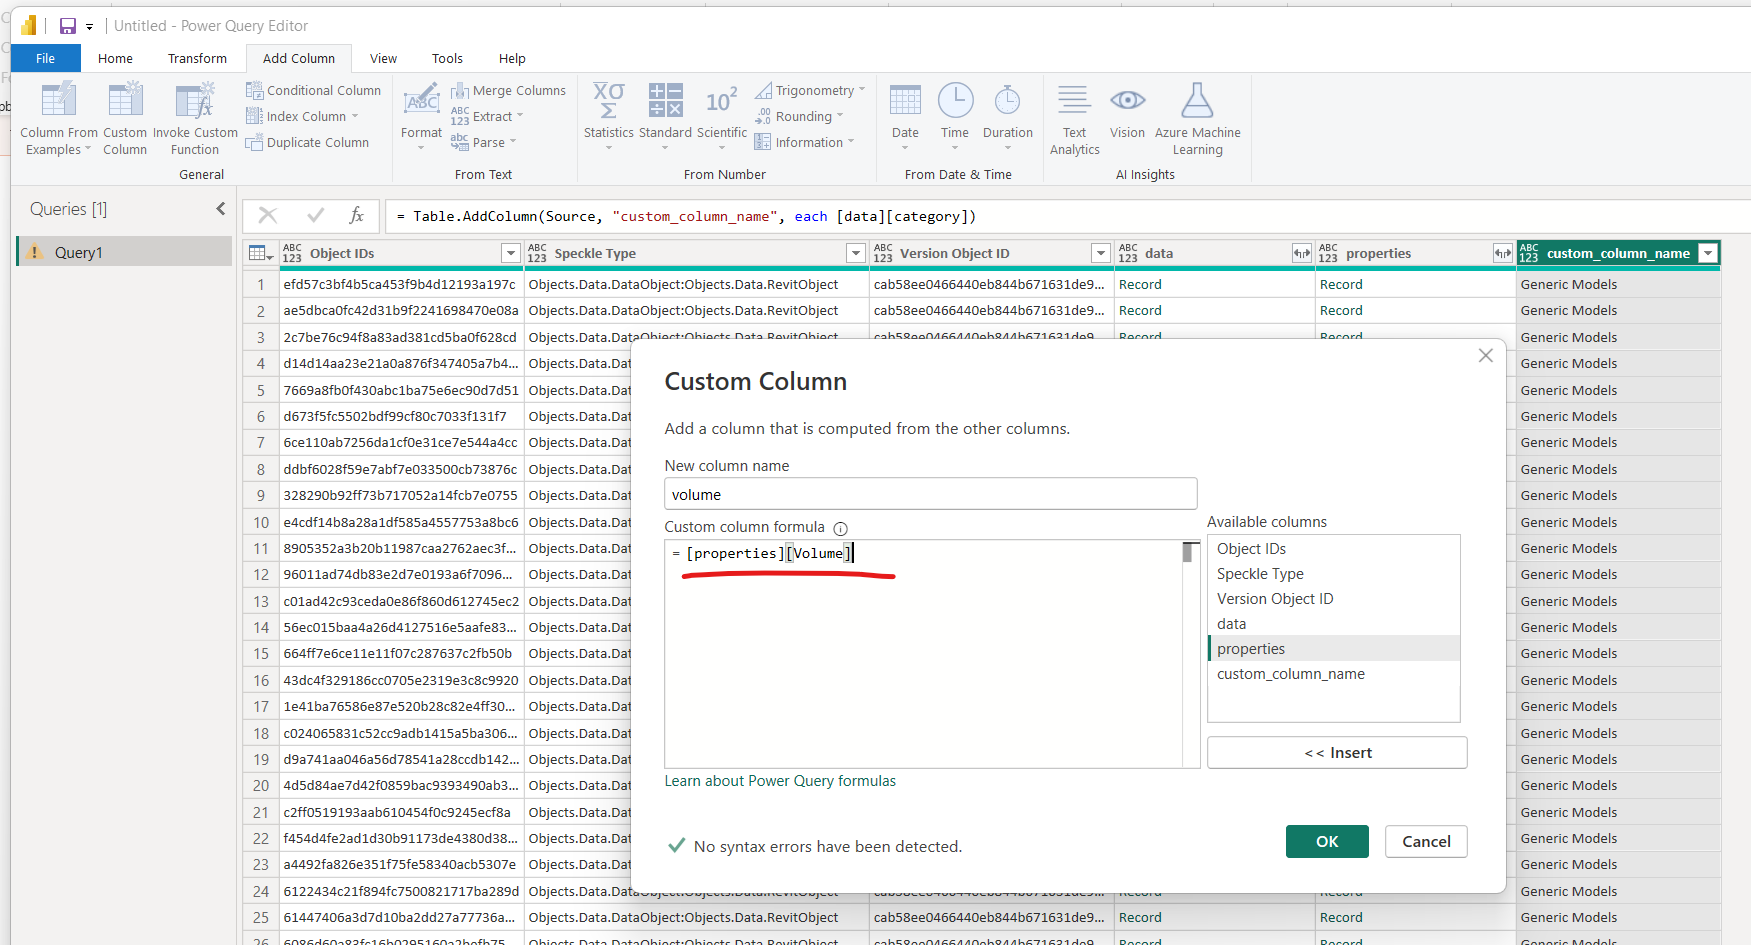
2__ Similar, you can use the [properties] record to access parameters that are nested under properties: ie. Area, Volume, elementId, Workset, Design Option, etc…
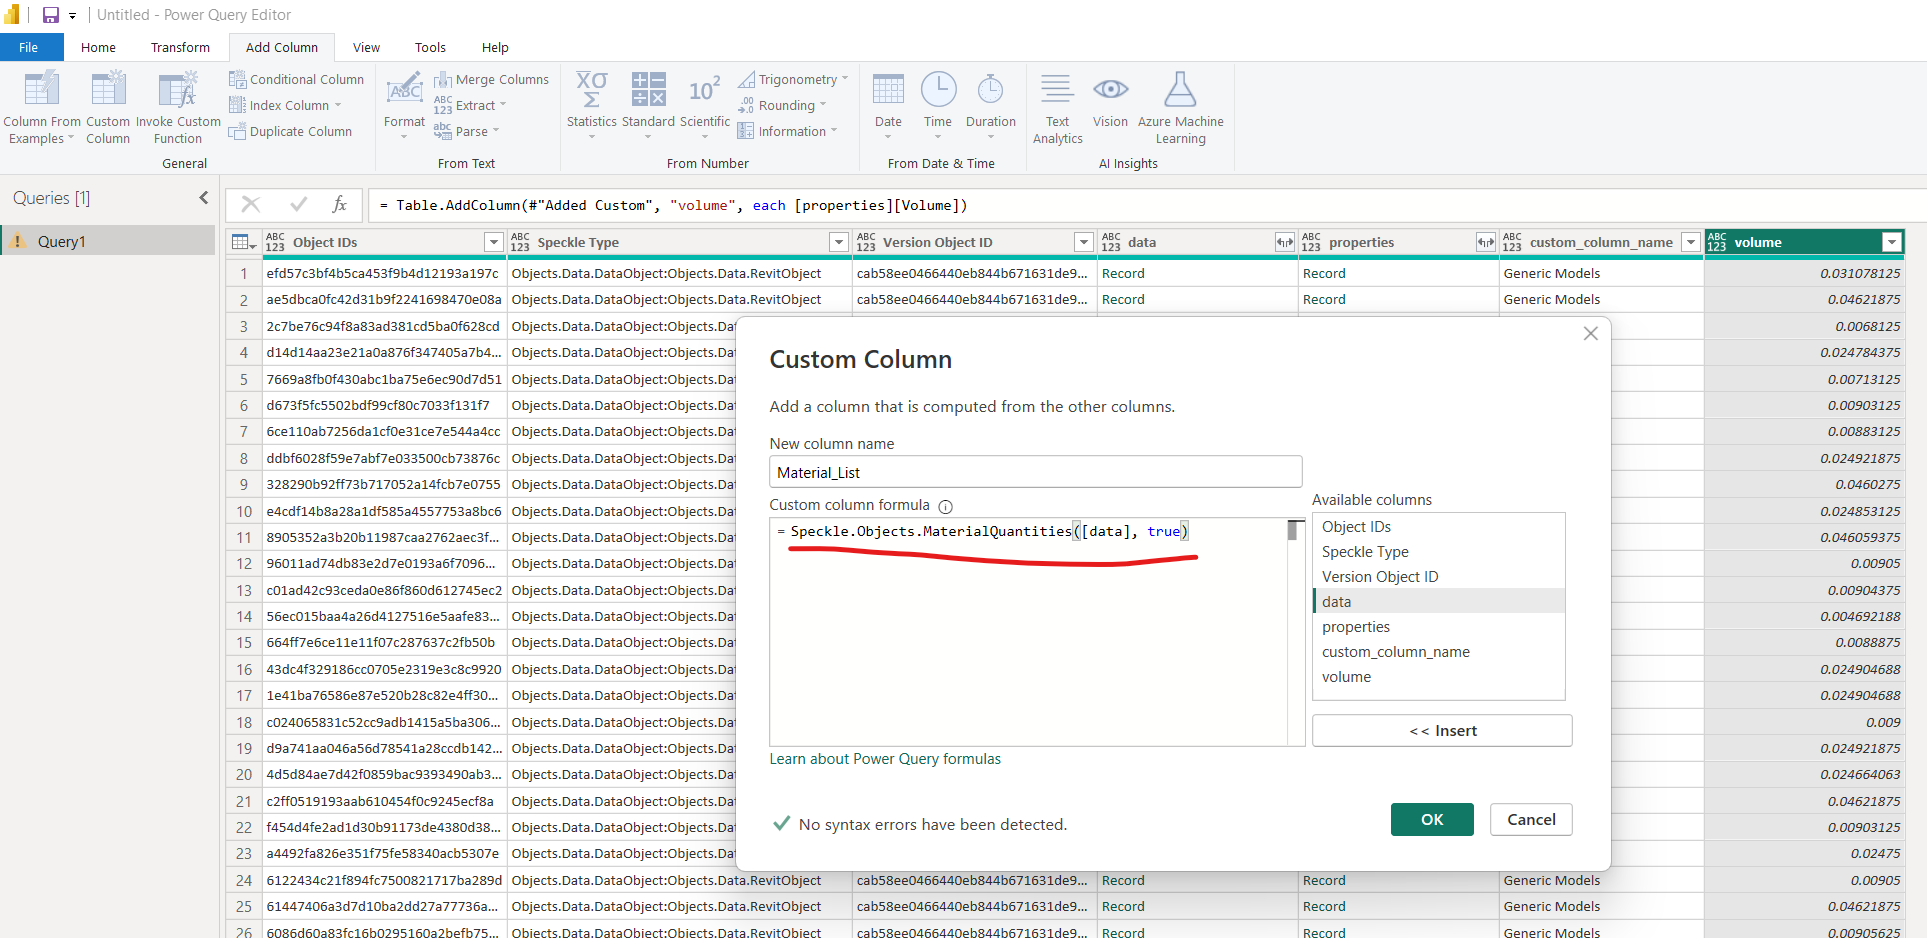
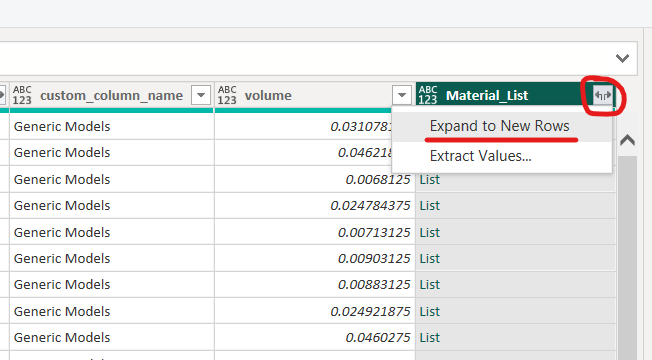
3__ For Material Quantities and Composite Structure you need to follow a different way because one object can have multiple materials and multiple layers - and is extracted as a list.
We have some helper functions for that to help you.
I hope this is helpful to get started. You can also start experimenting with the other helper functions to simplify and make things quicker, up to you.
Let me know if you have more question.
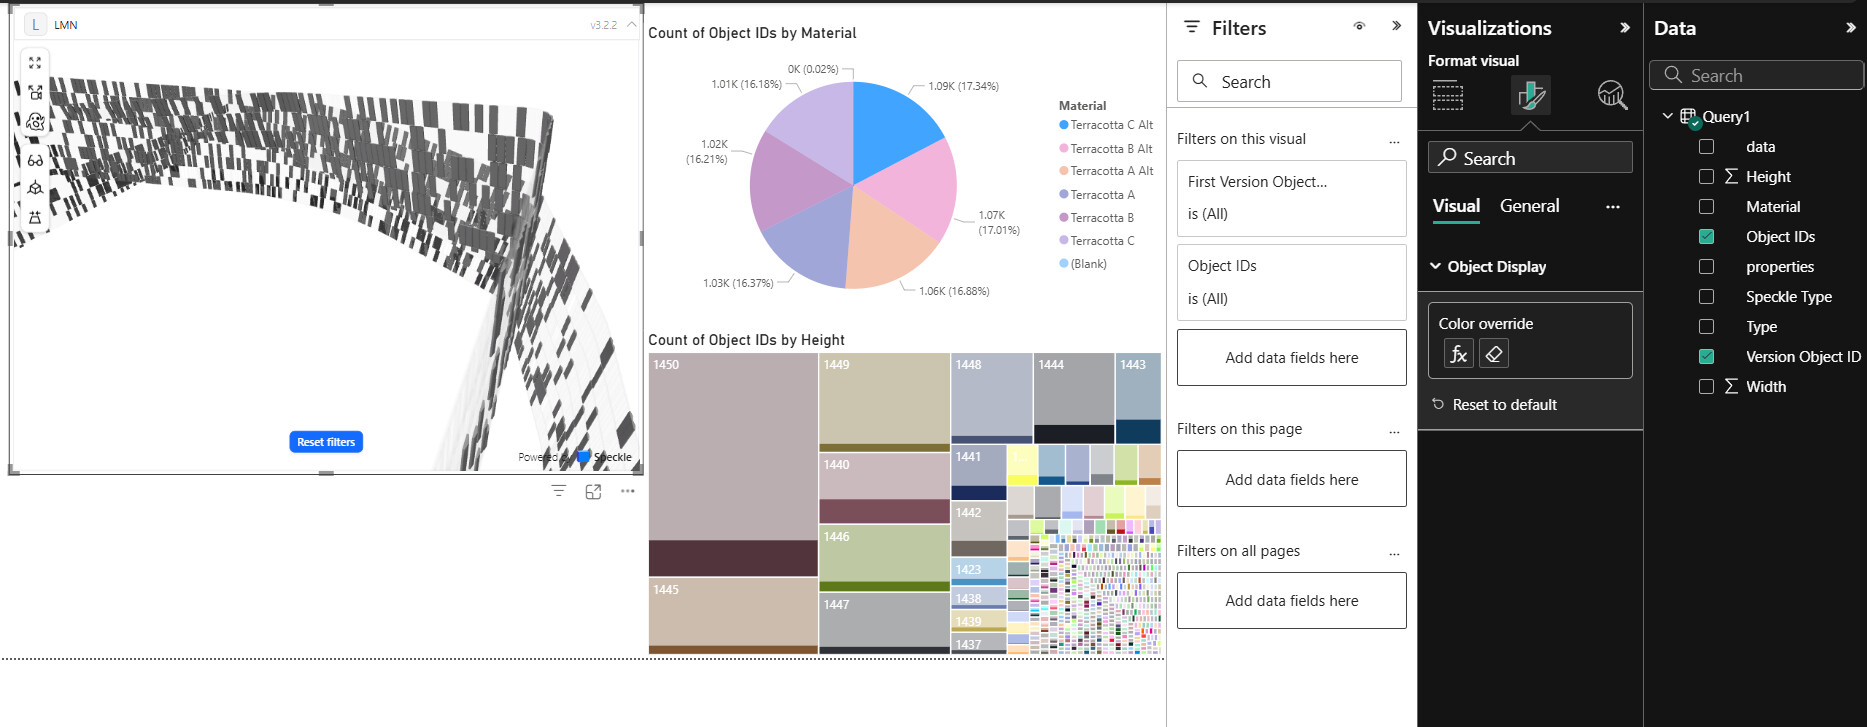
@Nikos this is great, thank you so much for this walkthrough! (first time using Power BI…) - I’m curious is it possible for the Speckle 3D viewer to take on color schemes being used by other charts? For example, in my snip below, I have selected “Terracotta C Alt” in the top left Material pie chart. While the visual is filtering to only show the Material selected, it doesn’t adopt that preview color. It would be helpful if I was able to have visual consistency across charts/visuals to help convey consistency of information.
@Nikos Nevermind! I see a “Color By” field in the main parameters which does exactly what I was hoping it would do. Thanks again, I’ll reach out if I come across any additional questions.
@Nikos actually it doesn’t quite sync up - What I’m hoping it would do is inherit colors being used in a different visual. For instance if I’m using a pie chart to isolate data, the corresponding elements in the 3D viewer would take on that color. If I were to go to a different visual with different colors, the 3D visual would filter to those elements with a consistent color. Does this make sense?
From what I understand is happening, it’s still coloring by the “By Color” parameter, but it’s using the default colors established in Power BI to actually provide that color.
Thanks again for your quick comments, very much appreciated!