Hi there,
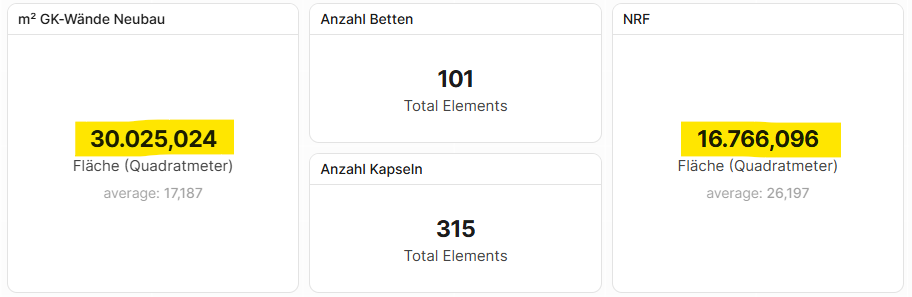
We noticed that certain widgets in Intelligence Dashboards have a tendency to report faulty values. Upon loading the dashboard, we are met with these numbers, which we know to be way too high:
When editing the filter settings, then immediately exiting out of the dialog (without changing any settings), the widget switches back to the correct values:
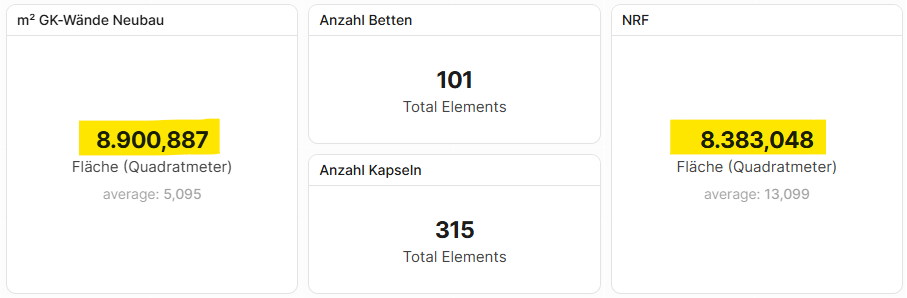
Both widgets are of type “total property value” and filter by model category and, partly, additional parameters. They are used to calculate a total area and a sum of wall surfaces, respectively.