Hi! I want to relive this topic because I did all steps and they didn’t help in my case ![]()
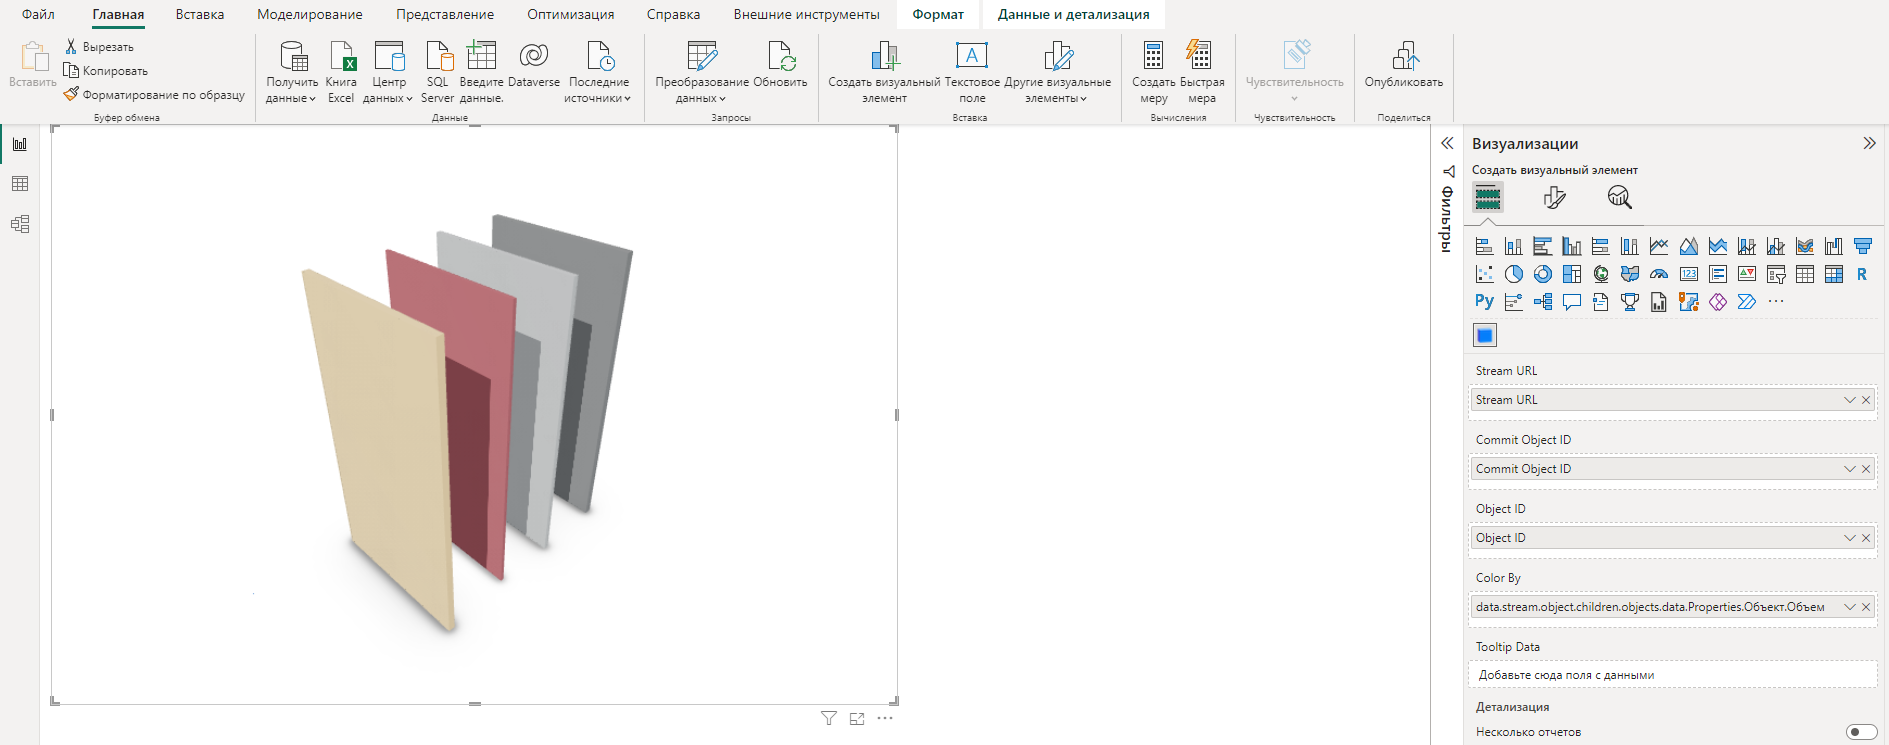
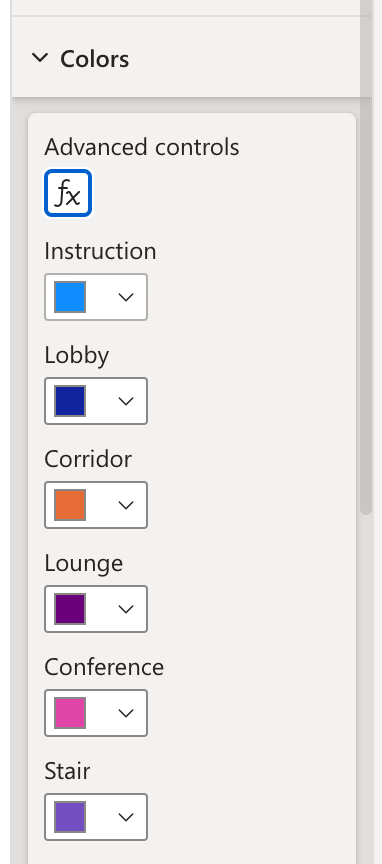
Colors, that you see on screenshot, do not change, no matter what parameter I set.
Where am I doing wrong?
1 Like
Hmm… @IrinaB this could be a bug in the new input logic.
Could you add some value to the tooltip data and verify if it works when all inputs are connected?
EDIT:
FYI, you should now also be able to name these columns whatever you want in the latest version (either in the Data Connector table, or renaming the visual input directly)

Interesting! I’ll be doing some extra work in the coming weeks so I’ll definitely look into this!
I noticed you’re adding the same input to tooltip data and color by.
Does it work if you input something else to the tooltip, such as the speckle_type column?
Just trying to figure out whats up.
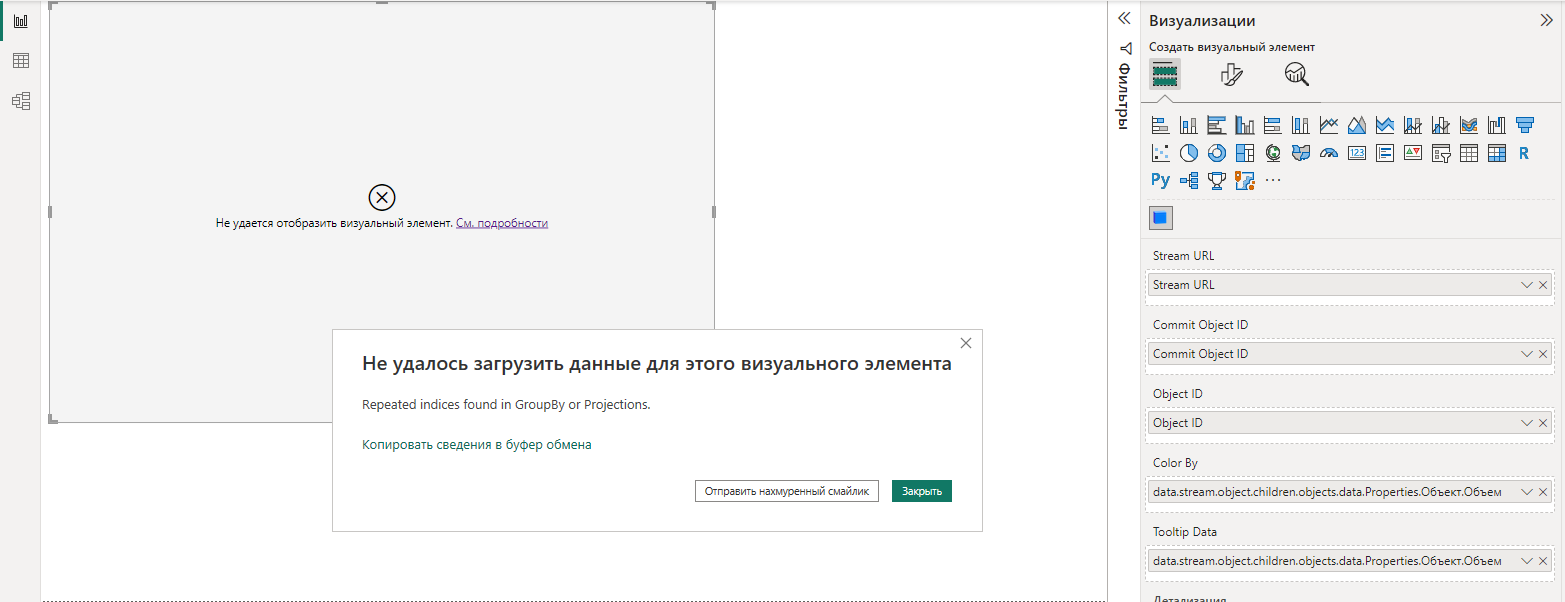
As for your error, this is the first time I’ve seen it, could you share with me the report so I can easily reproduce this in my machine?
Tracking the issue here, if you’re curious ![]() Visual fails to load DataView: Repeated Indices found in `GroupBy` or `Projections` · Issue #34 · specklesystems/speckle-powerbi-visuals · GitHub
Visual fails to load DataView: Repeated Indices found in `GroupBy` or `Projections` · Issue #34 · specklesystems/speckle-powerbi-visuals · GitHub
Thanks Alan!) I tryed to pyt another parameter and it works fine) and now i can’t reproduce error on my machine ![]()
I dont know, what was that)))
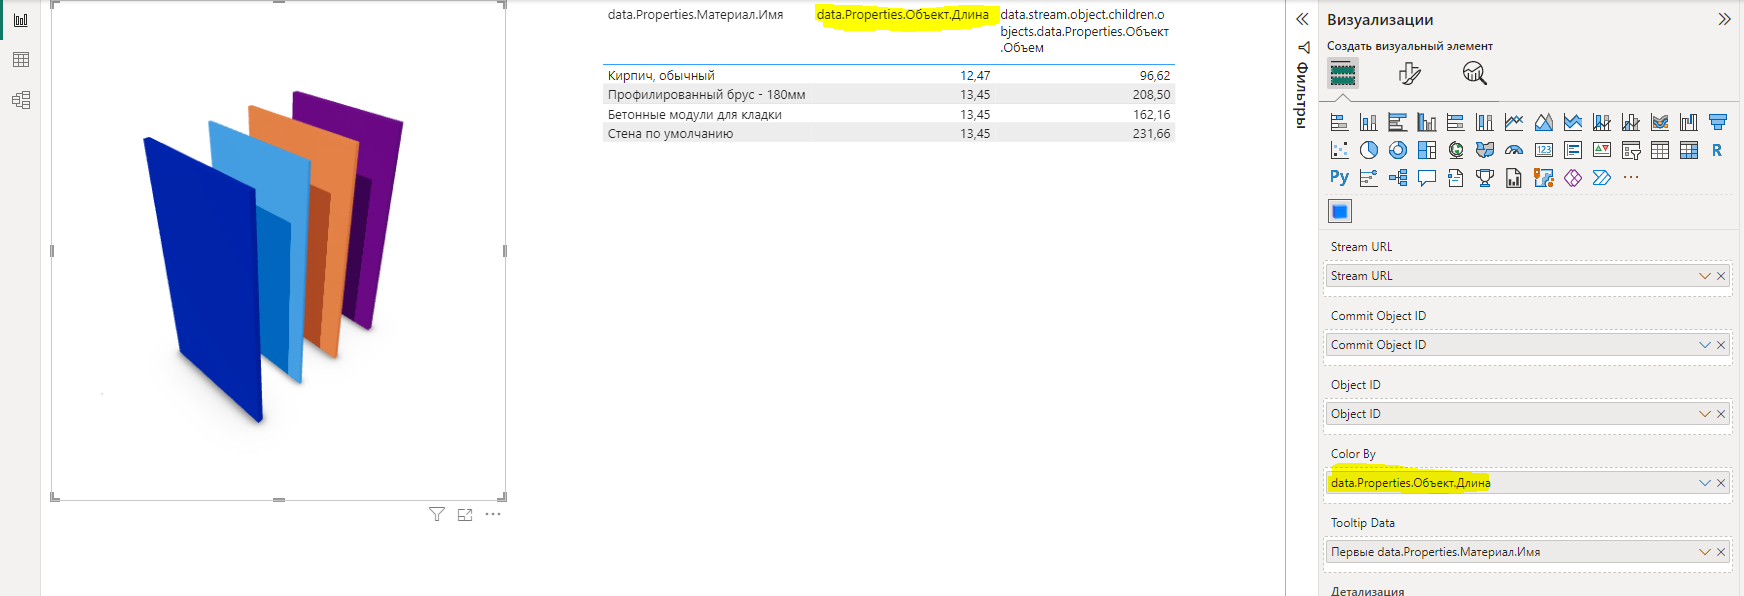
But I have another question. I input a numeric parameter, that has 2 values, and i thought the coloring should have 2 colors, but it has 4 colors. Why?
1 Like
I’ll try to reproduce this on my end to see what’s going on!
Thx for the feedback!
1 Like
Hi! I would like to know if there is any news on the topic?
1 Like
Not really, I haven’t had a chance to look into this yet, but it will be fixed for our next release for sure.
One thing thing that occurs to me is to set the Color By input to “do not sumarize”, save the report and reload the page. Colors are being currently stored upon creation, so if you’re changing how things are coloured you’ll have to reload for them to apply in some cases.
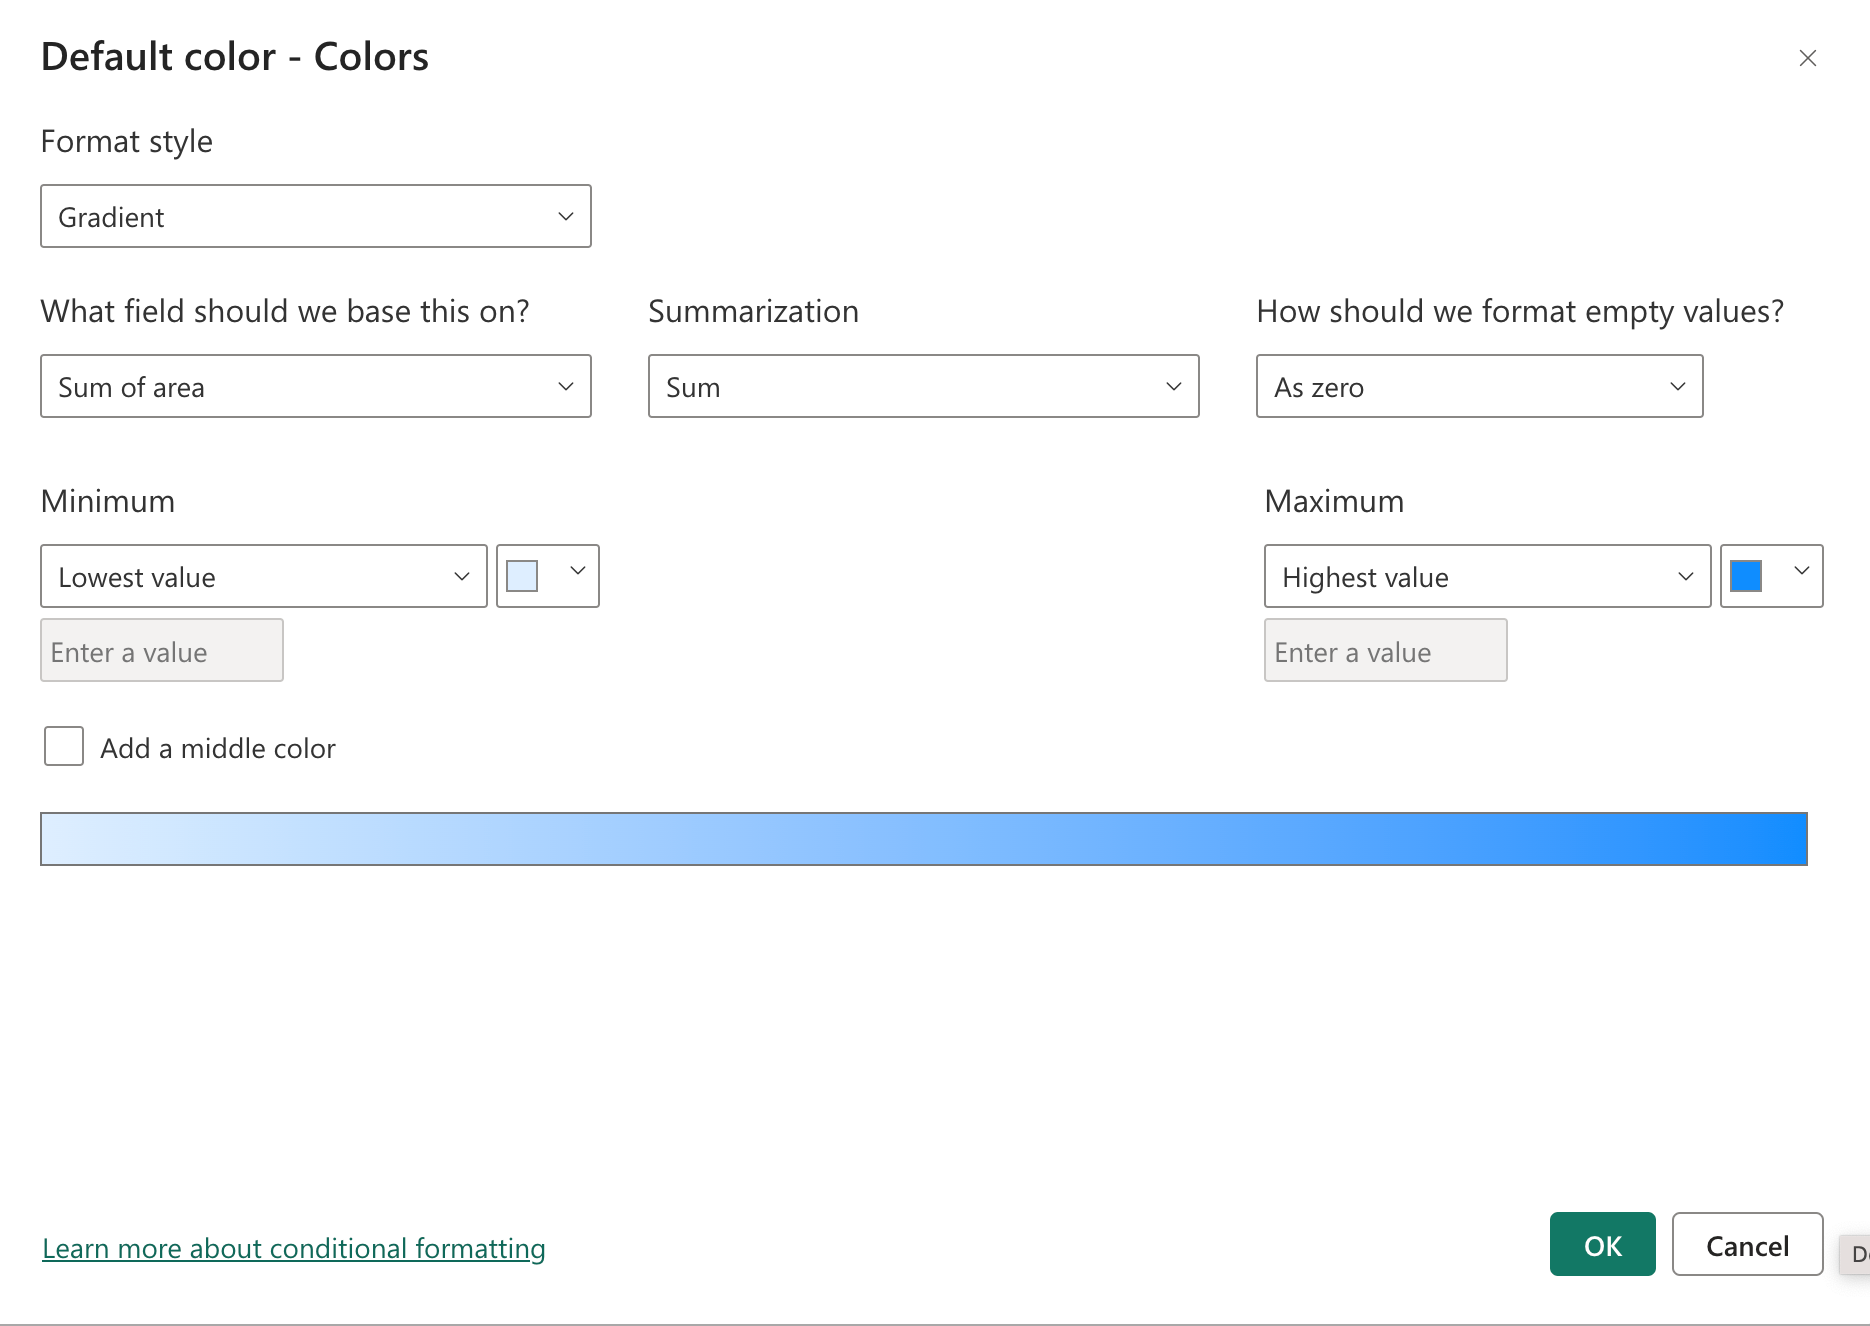
We already had scheduled adding colour customisation and that’s going to require some changes in the colouring logic to allow for PowerBI’s own coloring menus (gradients, rules, color overrides) in a similar way that the TreeMap component does
Our aim is to release this in the coming weeks, so stayed tuned! ![]()
2 Likes
Good news!) Thank you!)
Glad I found this thread, I was going mad with this. I have noticed as long as you have 2 fields in Object ID or at least one field in TT it works.
There is one thing I don’t understand, which is the current “Colors” menu… I don’t get how that affects the viz.
And the other thing I was loving about a previous version of the visual but seems to have disappeared now is that before, by selecting an element (either in the 3D visual or in a table/filter), it was zooming onto the object and “isolate” it from the context, now it only selects it but not zoom/focus… Only on my end?
Also, it’d be nice to be able to switch between ORIGINAL COLOURS/OVERRIDE COLOURS.
Thanks for the great job, though, it’s the first visual I see that works this smoothly and with a super-friendly setup! It was long due!
3 Likes
Hey @ecalzavara ![]() ,
,
Currently, we are working on the new “Colors” menu. Maybe @AlanRynne can give a sneak peek😉. Hopefully, the issue you are experiencing will get solved with this update.
@AlanRynne maybe we can add this as a setting. Wdyt?
I guess this one can also be added in the settings dialog.
2 Likes
Yes ![]() Zoom to focus is making it’s way back as a setting next release
Zoom to focus is making it’s way back as a setting next release ![]()
Do you mean being able to configure if you see the original colors or the color overrides as a setting? Or that the user viewing the report should have a button to toggle this?
Right now, we’ve stuck to PowerBI’s way of doing things. So it’s either/or: Either you apply a color override, or you do not. But the user viewing the report will see only what you configured, and has no option to change colors on his end.
If this assumption is wrong, I’d be happy to be corrected! ![]()
![]()
this is super good news, YEY!
For the colour override, maybe there is not much to do on your end, if it’s not possibly to TURN ON/OFF the “Colour By” parameter. Maybe it’ll have to be on the report creator side to create a measure/c.column to be switch between colors/empty when a button/bookmark is selected or based on different attributes.
Was just throwing it out there to see if it was an option, I think it’d be required. ![]()
1 Like
Thanks for the feedback!
We’ll definitely have a look to see if this is possible on our end with some button in the Viewer so you can toggle the color filter.
I think this could be doable, but can’t make any promises yet ![]()
1 Like
Hi,
How far is the version with improved colouring capabilities. Currently I am not able to colour at all.
Hey @Morten.Kaasik ,
We are planning to release rc tomorrow (hopefully🤞). Keep an eye on Speckle Power BI Github repo.
2 Likes
Fantastic, good timing, i am working on exploring finding business case for the tekla-speckle link! ![]()
1 Like
Hey @here,
Power BI connector and 3D Viewer Visual release candidates are published. Give them a try and let us know what you think:
Power BI Connector: Releases · specklesystems/speckle-powerbi · GitHub
3D Viewer Visual: Releases · specklesystems/speckle-powerbi-visuals · GitHub
1 Like
6 posts were split to a new topic: Controlling colors in 3d visual