I will make a tutorial on this, but I have this as a brief explanation in the meantime (because I am on leave).
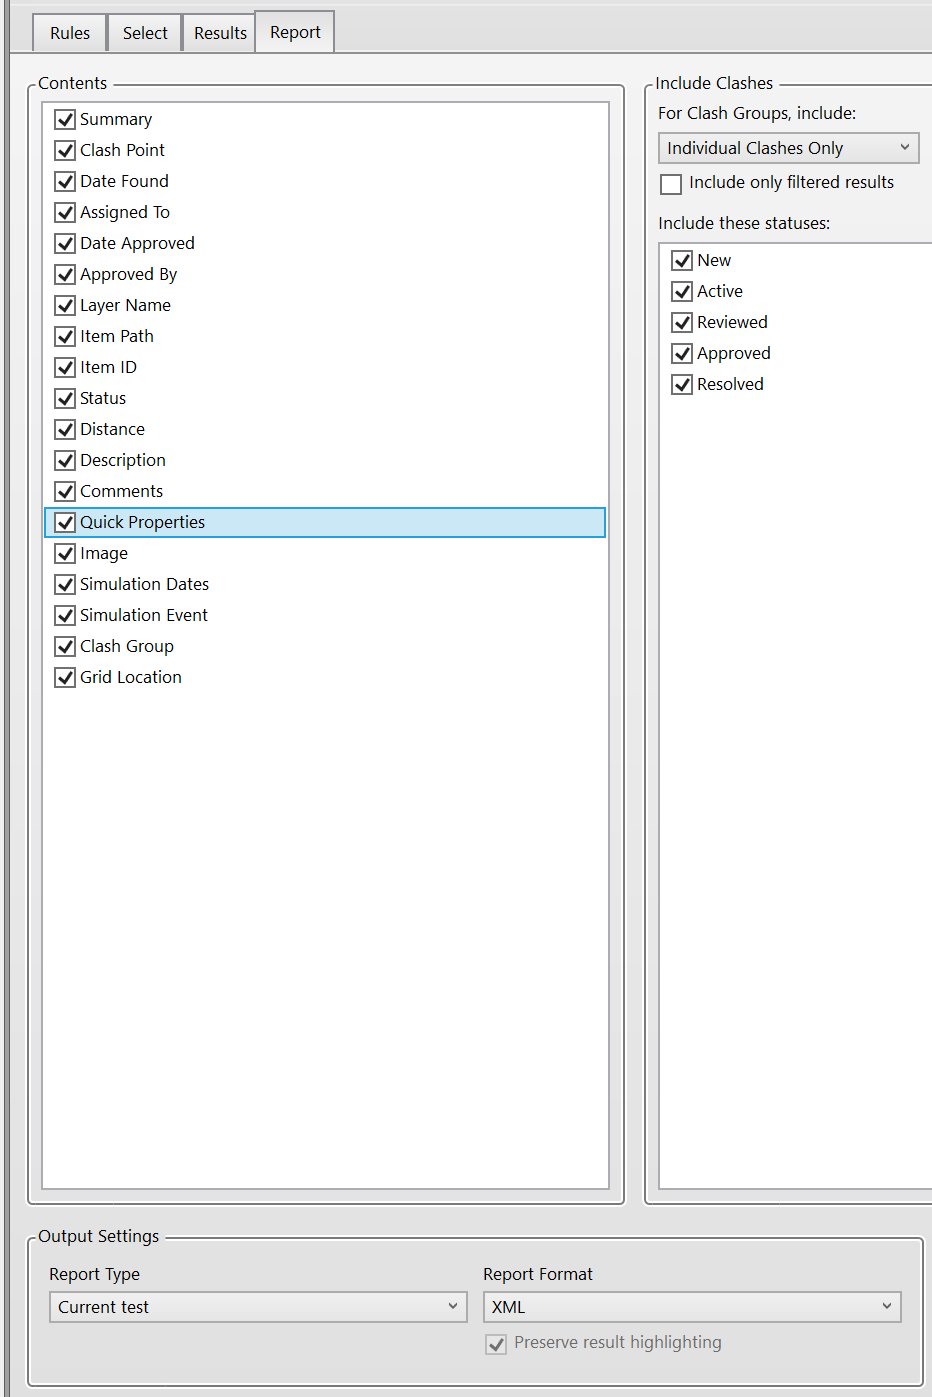
In Navisworks, you can set the Clash Report format to XML and make sure to include Quick Properties:
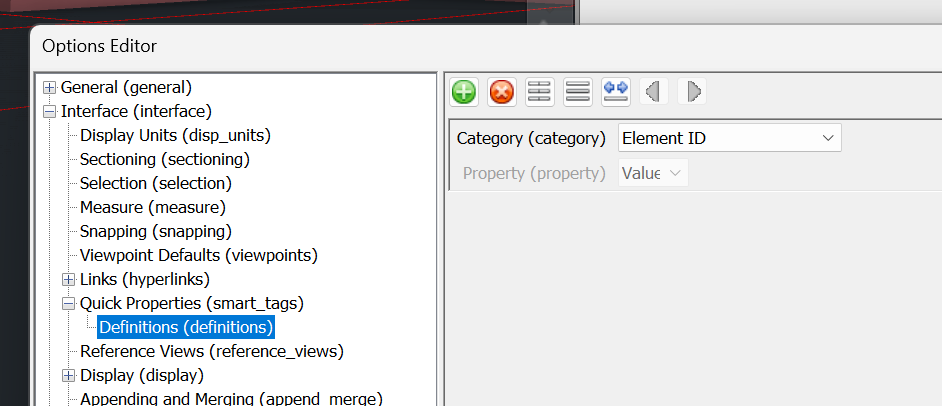
You can set Quick Properties in the General Options dialog:
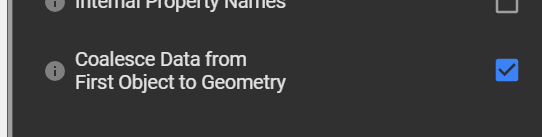
If when you Publish to Speckle from Navisworks you have the Coalesce data advanced setting enabled (now on by default since v2.20) the Element ID will propagate from the parent node to the Geometry elements inside Speckle:
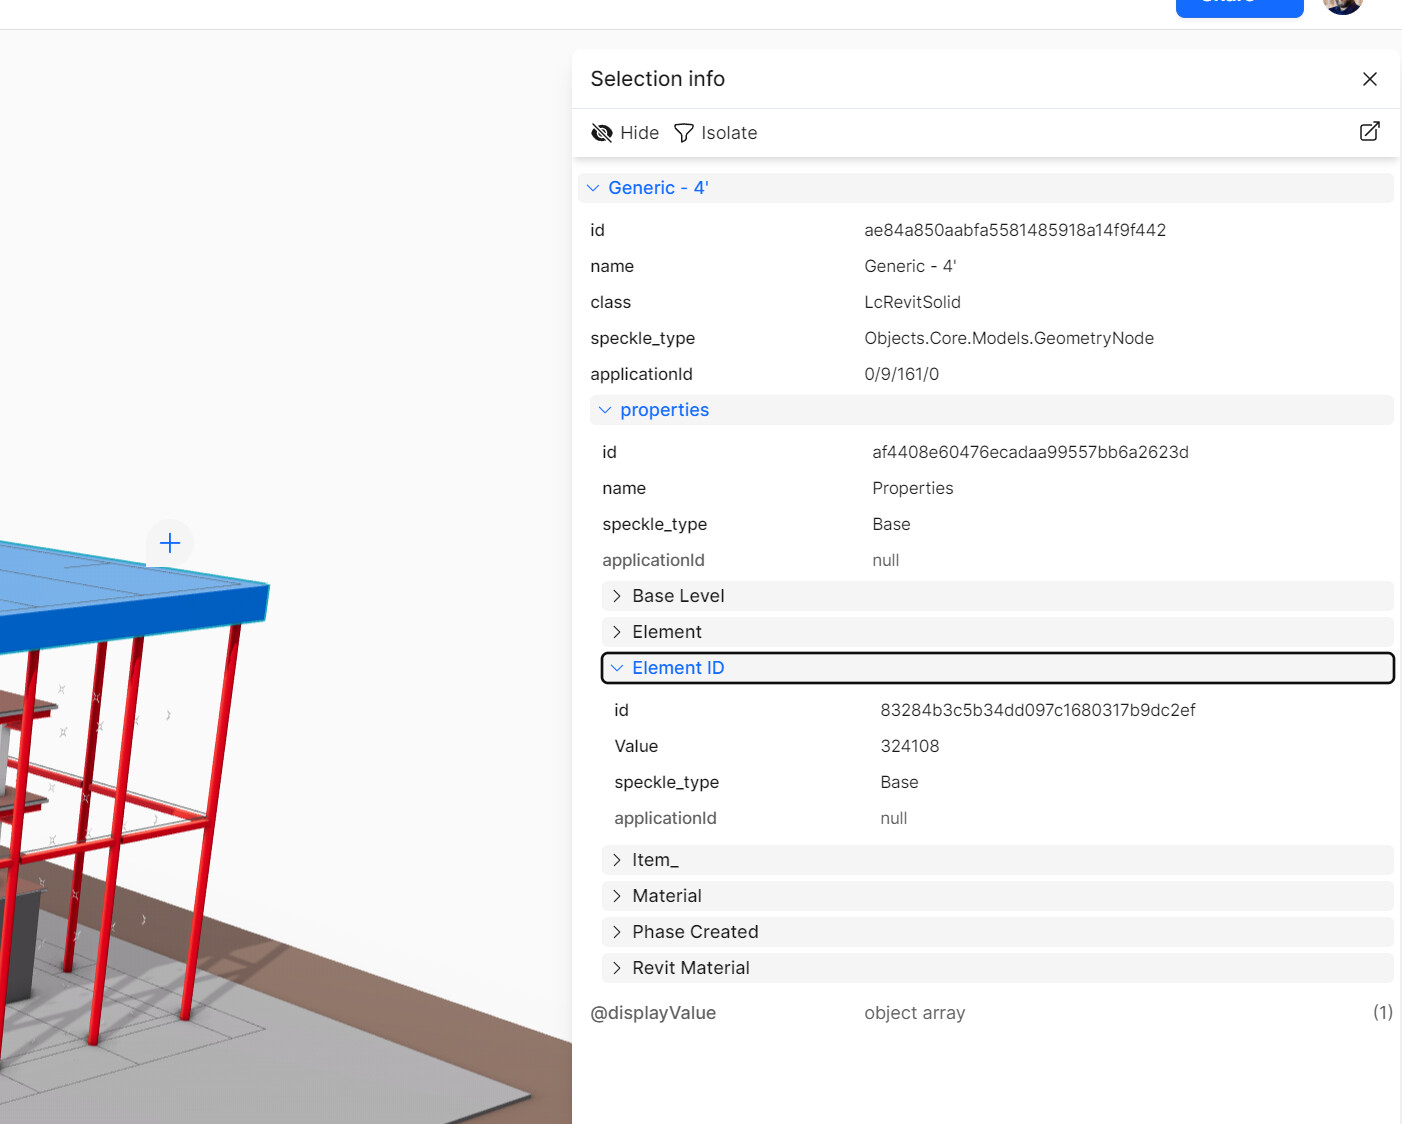
Assuming the data has come from Revit the Element ID will be present in Speckle:
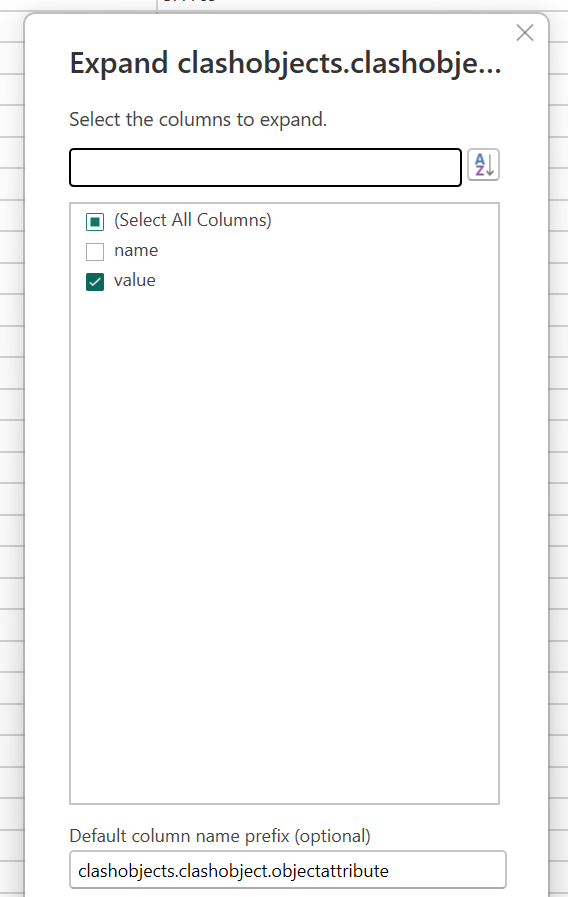
In PowerBI your task will be to manipulate the Clash Report columns to expose this Element ID in the clashobjects dataset:
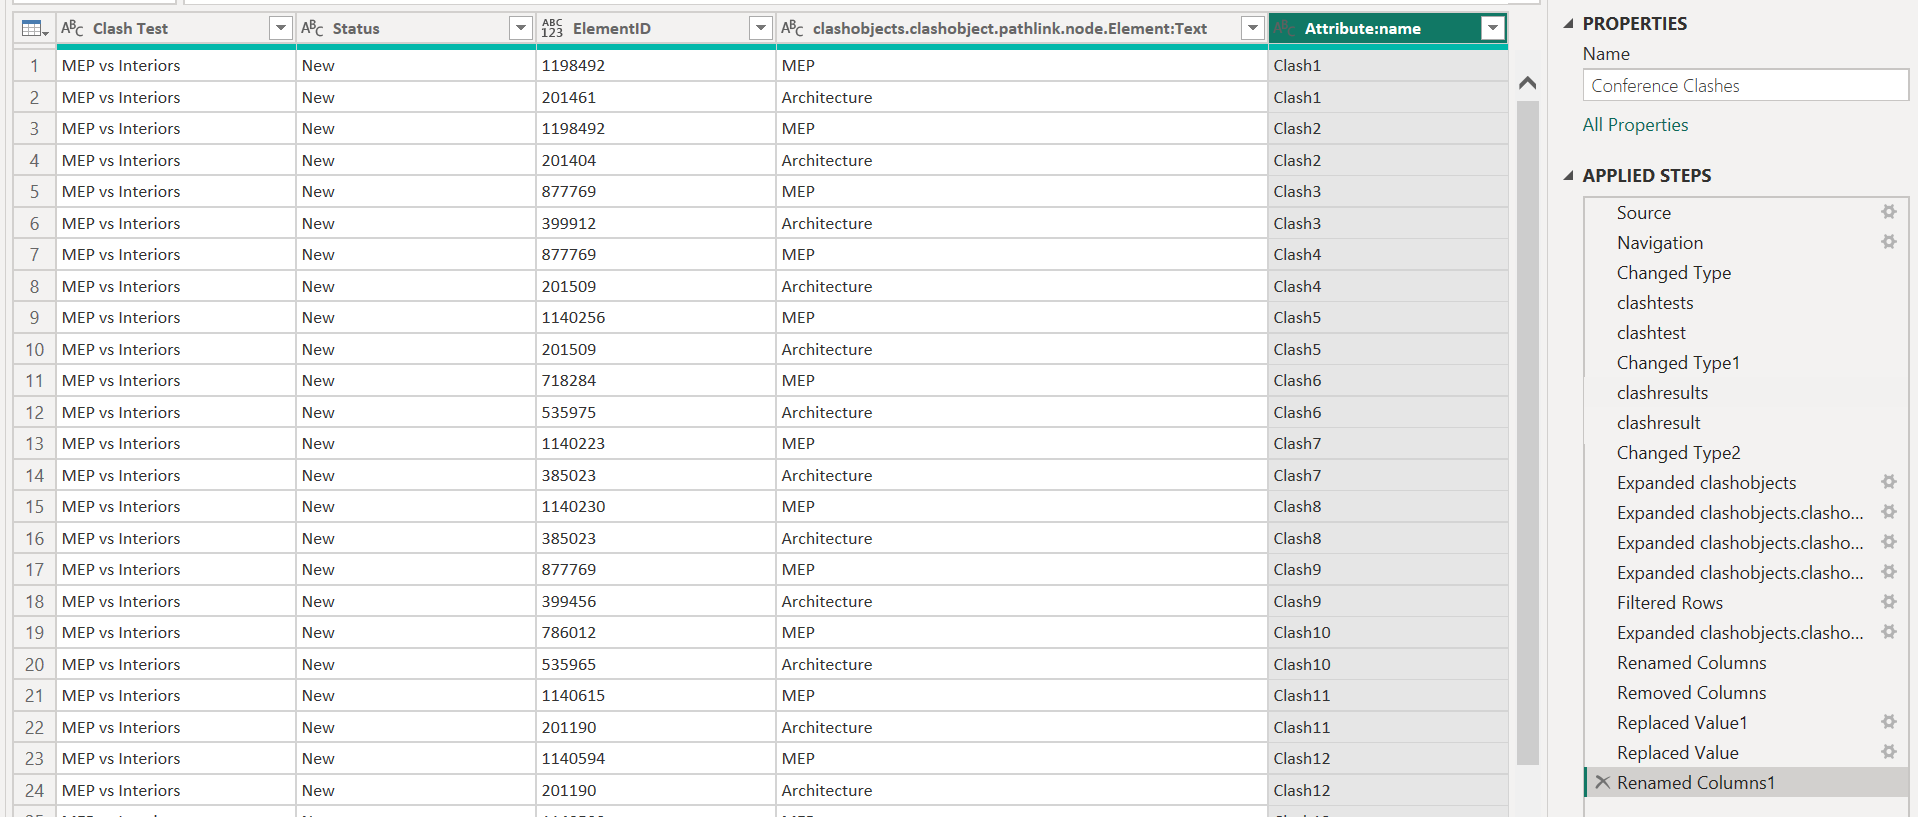
My Clash report at the end of its data transformation looks like this:
Receiving the Speckle data and doing the same property exposure is also multi-step:
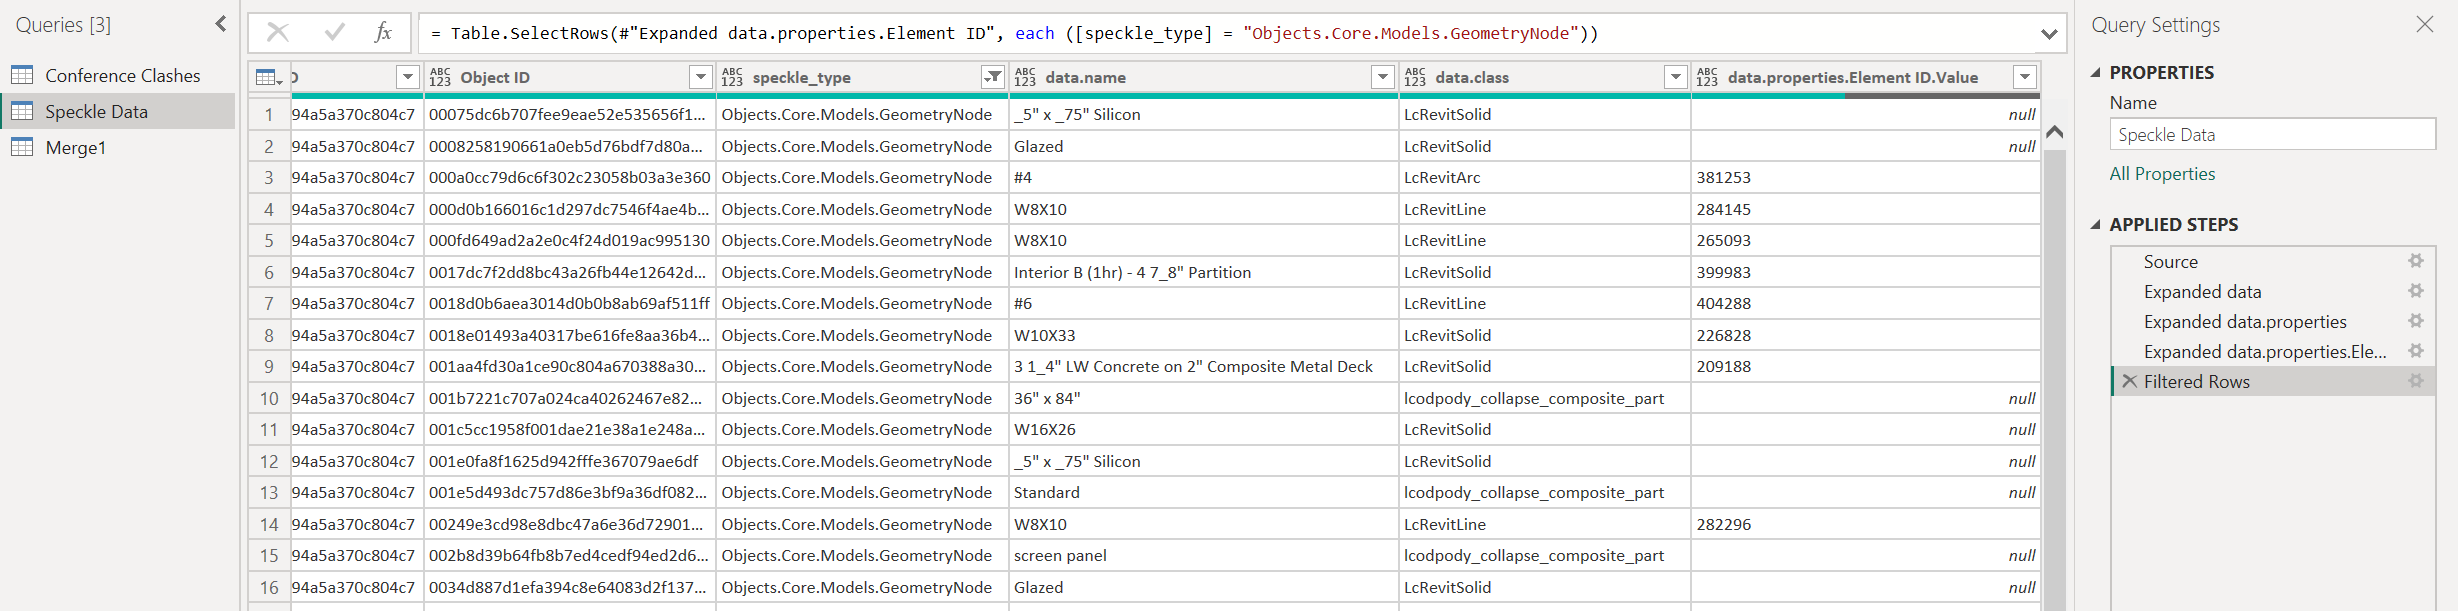
NB. You’ll notice here that for brevity I have filtered the rows to just include the GeometryNode speckle_type - Notice also that not all elements have an Element ID.value. (I will fo into why this is in a future note)
From here I make a data join Merge dataset, again for simplicity I am performing an Inner.Join just to constrain the demo file to where Element ID exists in the clash report and in the Speckle data.
And then because I cant hep myself a bunch of tidying up on the columns and data types of the Merge:
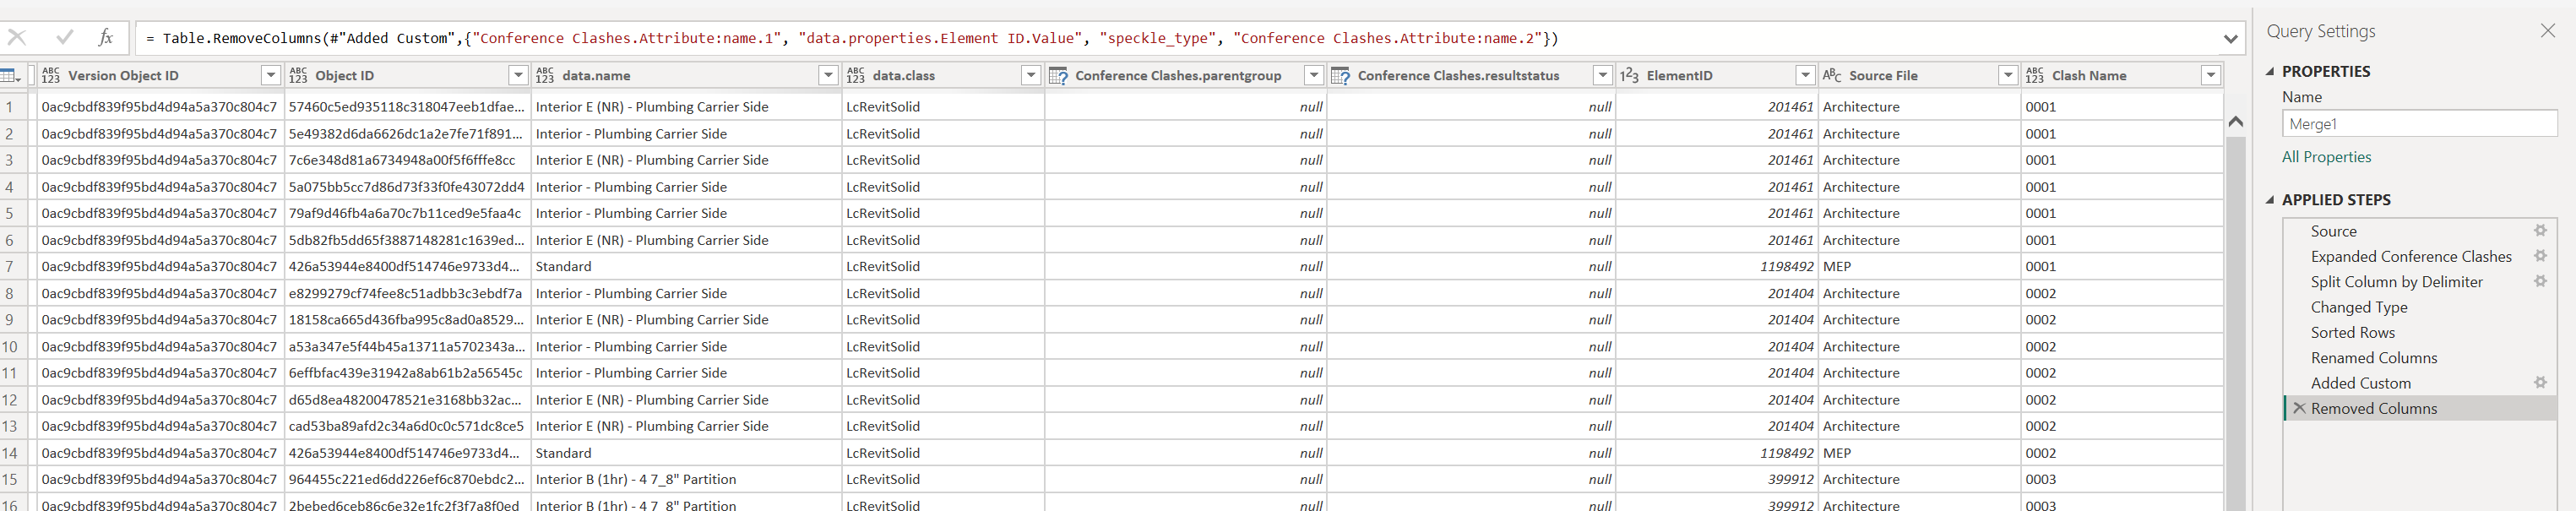
Ultimately what this gives is a data table that includes all the Speckle 3d visual requirements with the bare minimum of the clash data. With the visual provided the entire source model it will default to showing everything ghosted except those elements involved in clashes:
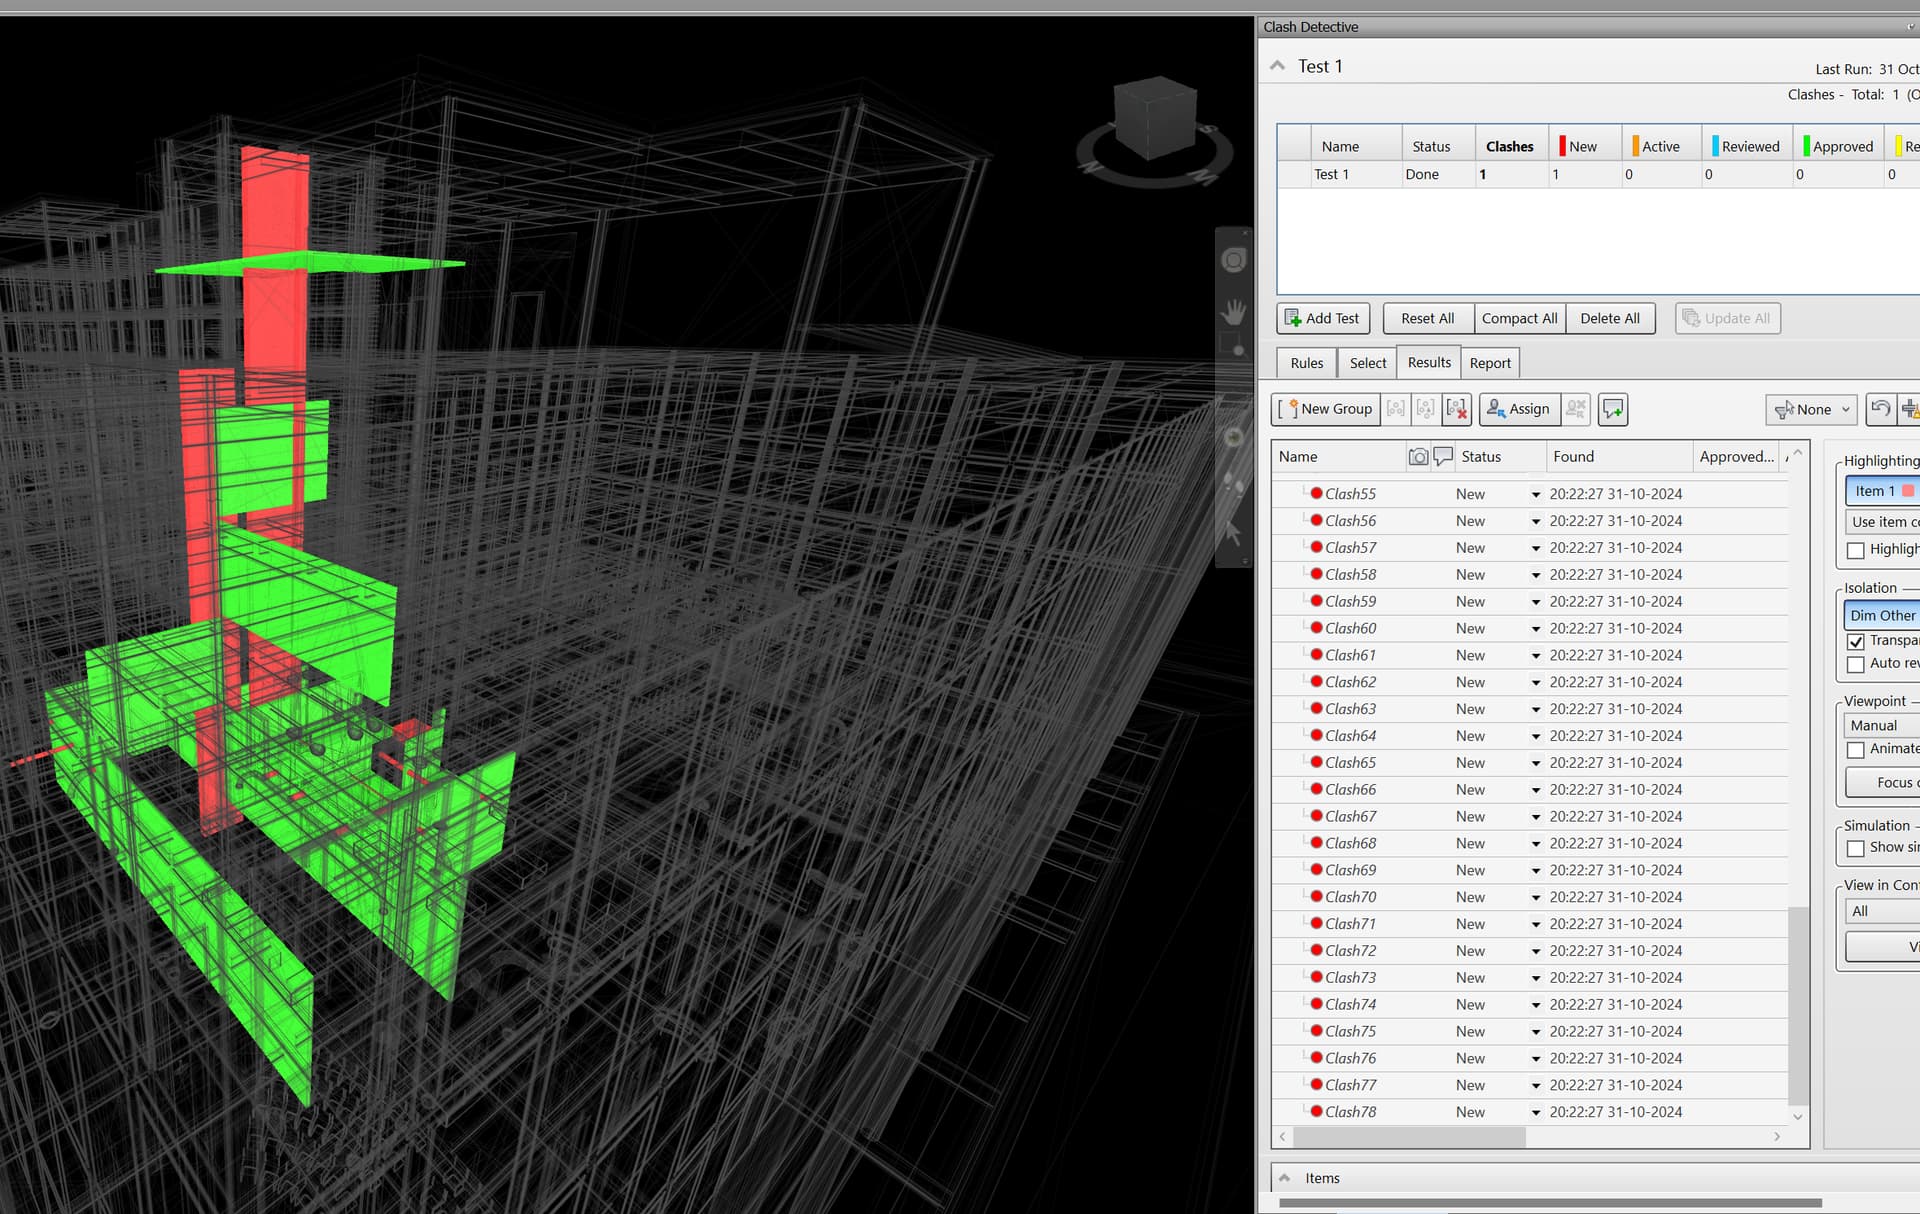
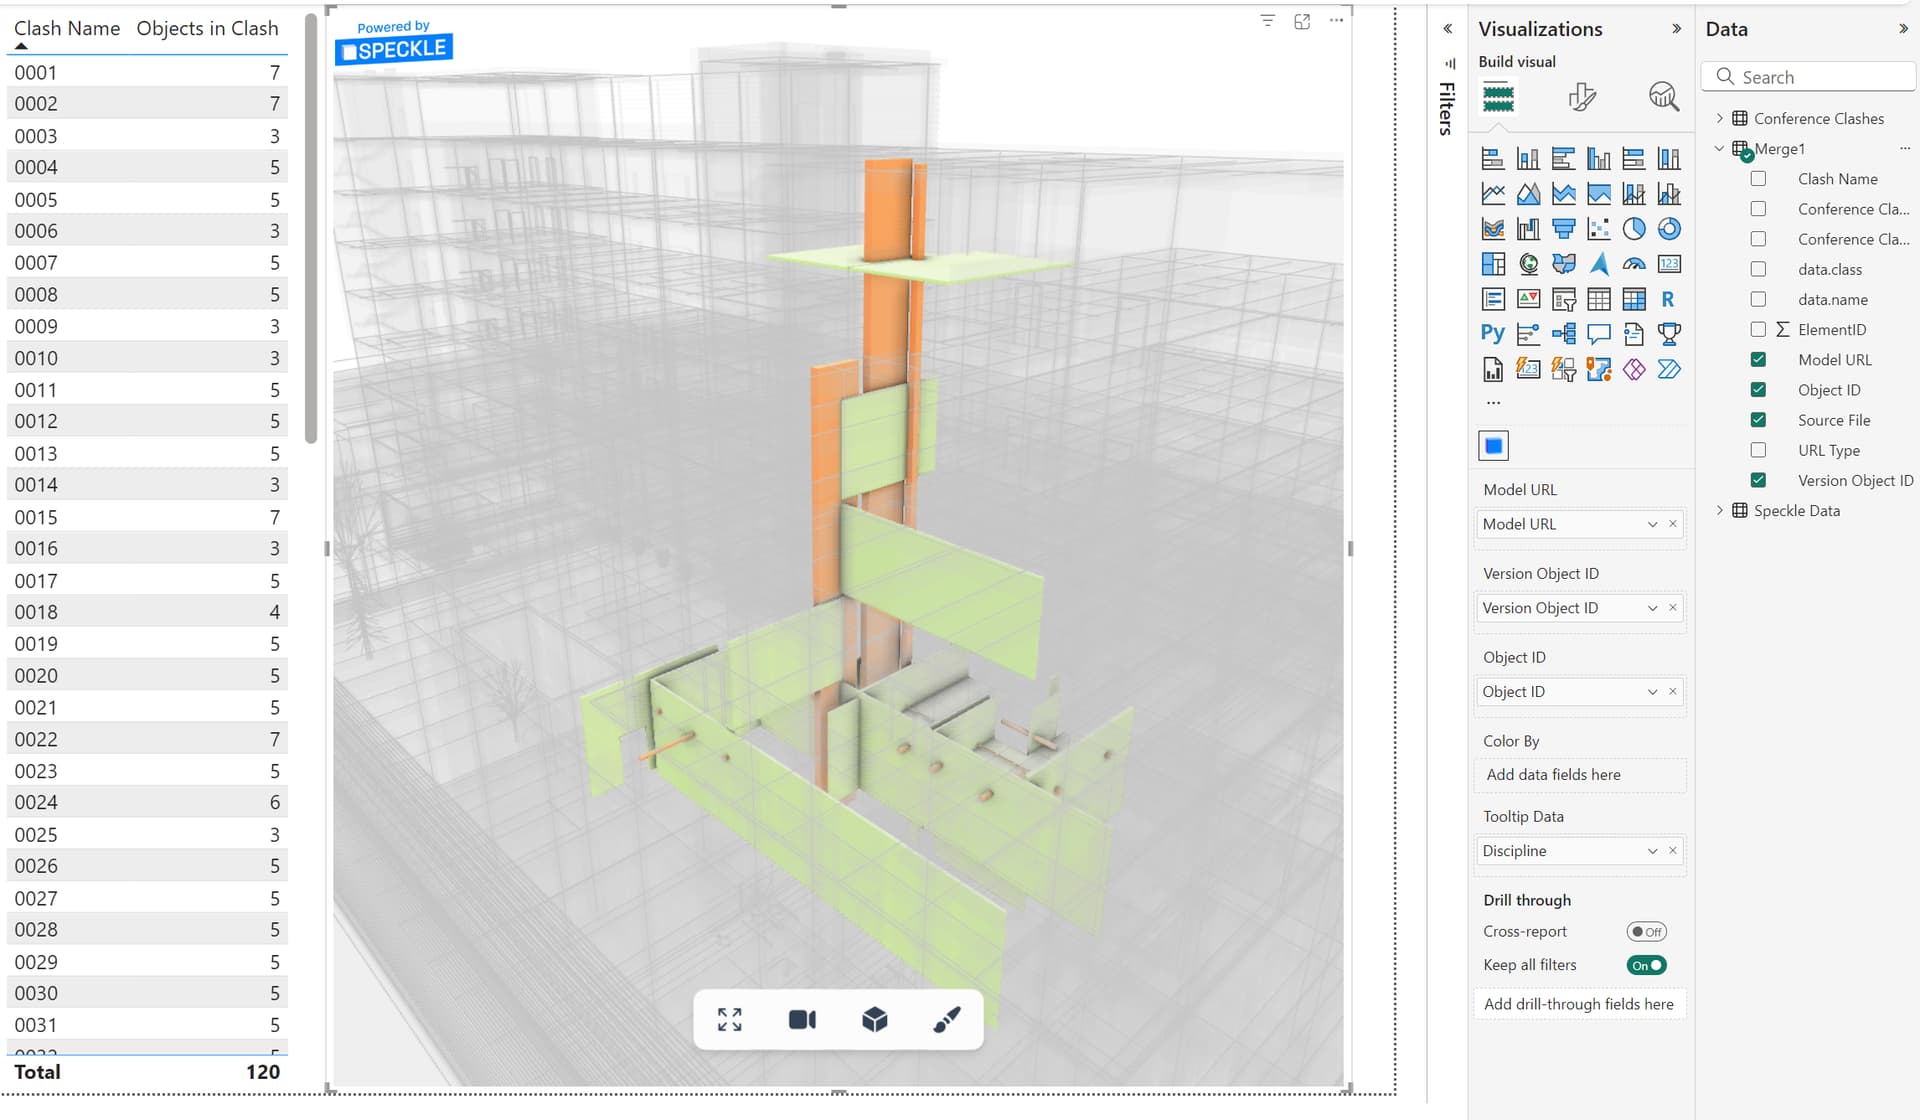
The two screenshots show the correlations.
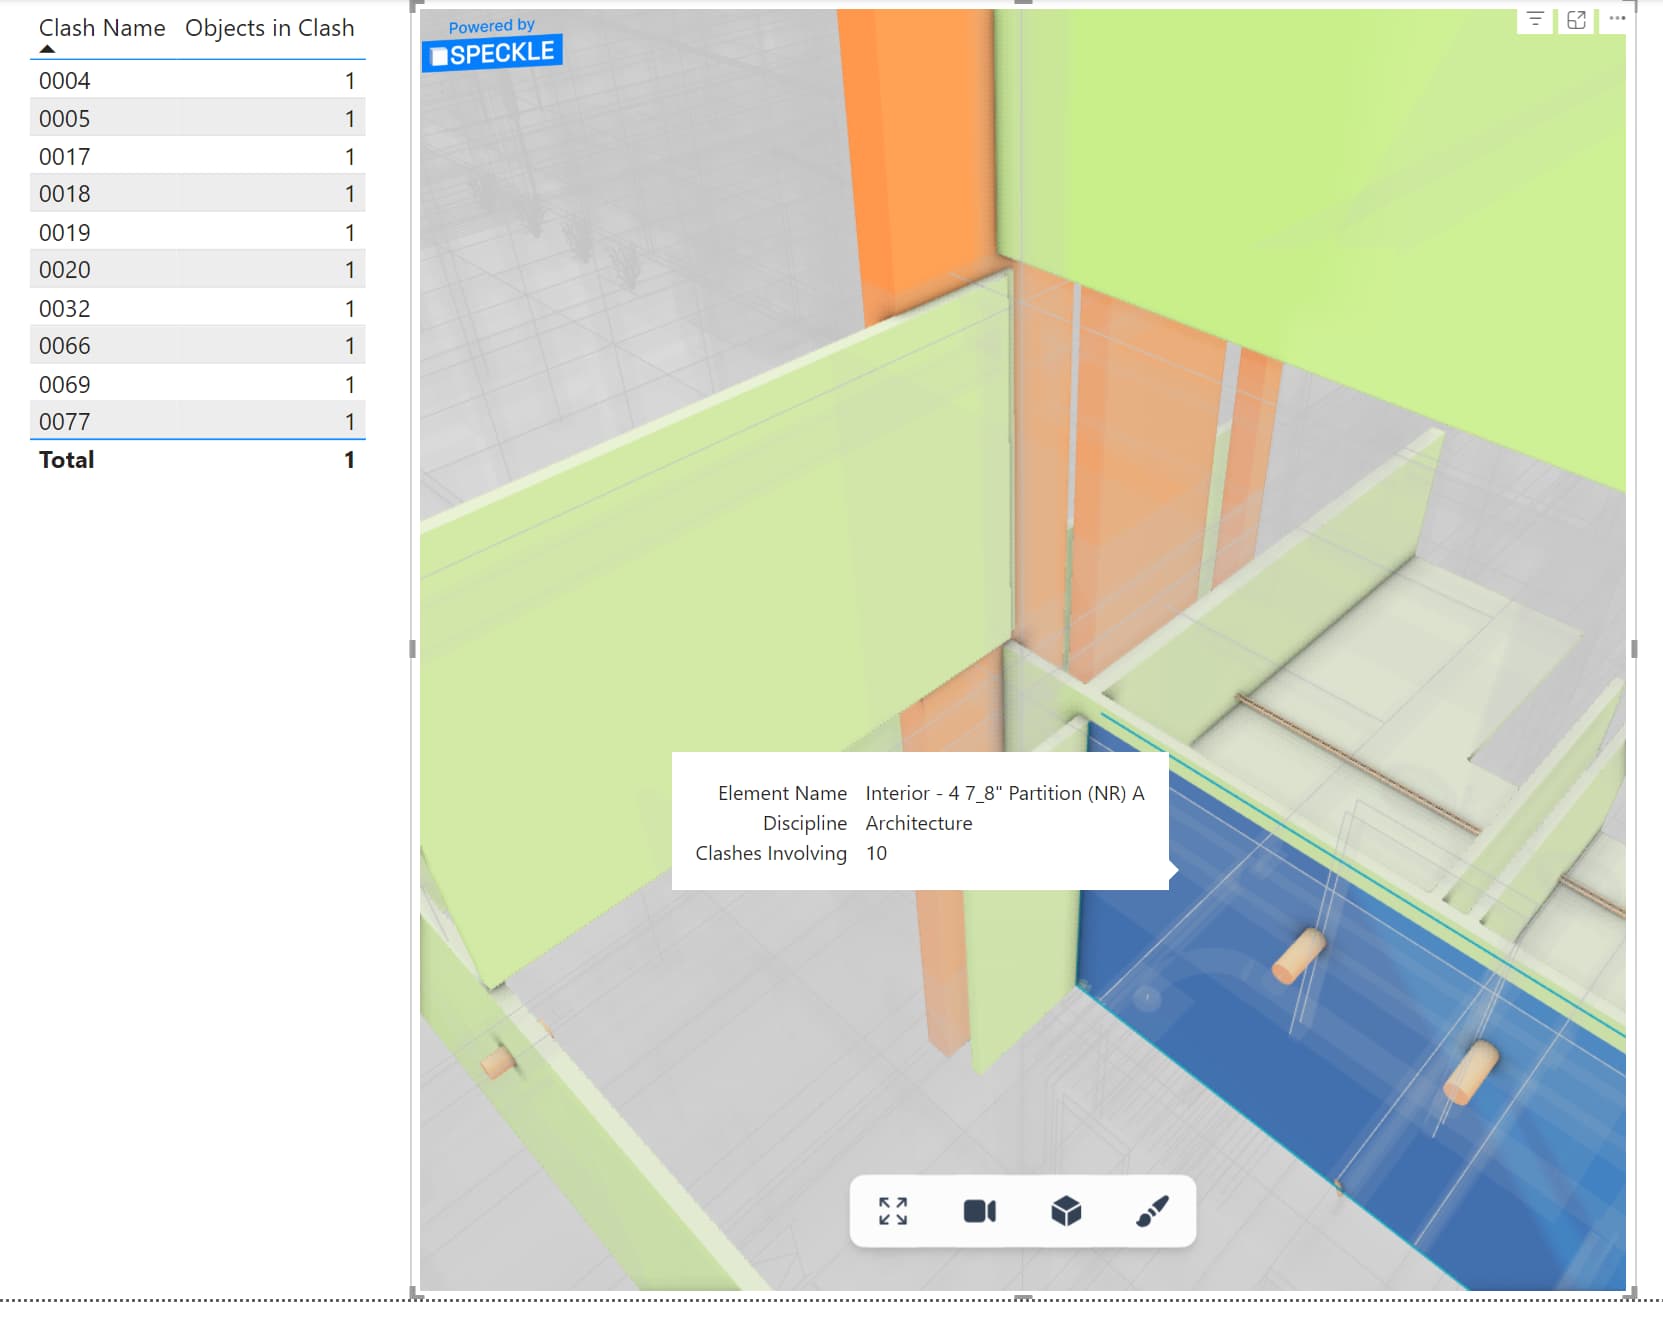
With that in place, whatever Slices you want to apply, By Test, By Clash, By Discipline can be applied between the table view shown left, or when selecting an element in the 3d visual, filter to the clashes that element is involved in:
Hope that helps.