Hello everyone! I would like to share my experience of working with Speckle models in the graph database.
In my PhD research, I have faced an issue where I need a richer context for an element within a model. For example, it is possible to determine which system a duct part belongs to within Revit, but it is almost never possible to determine which room it serves or, in other words, which room would be affected by its failure.
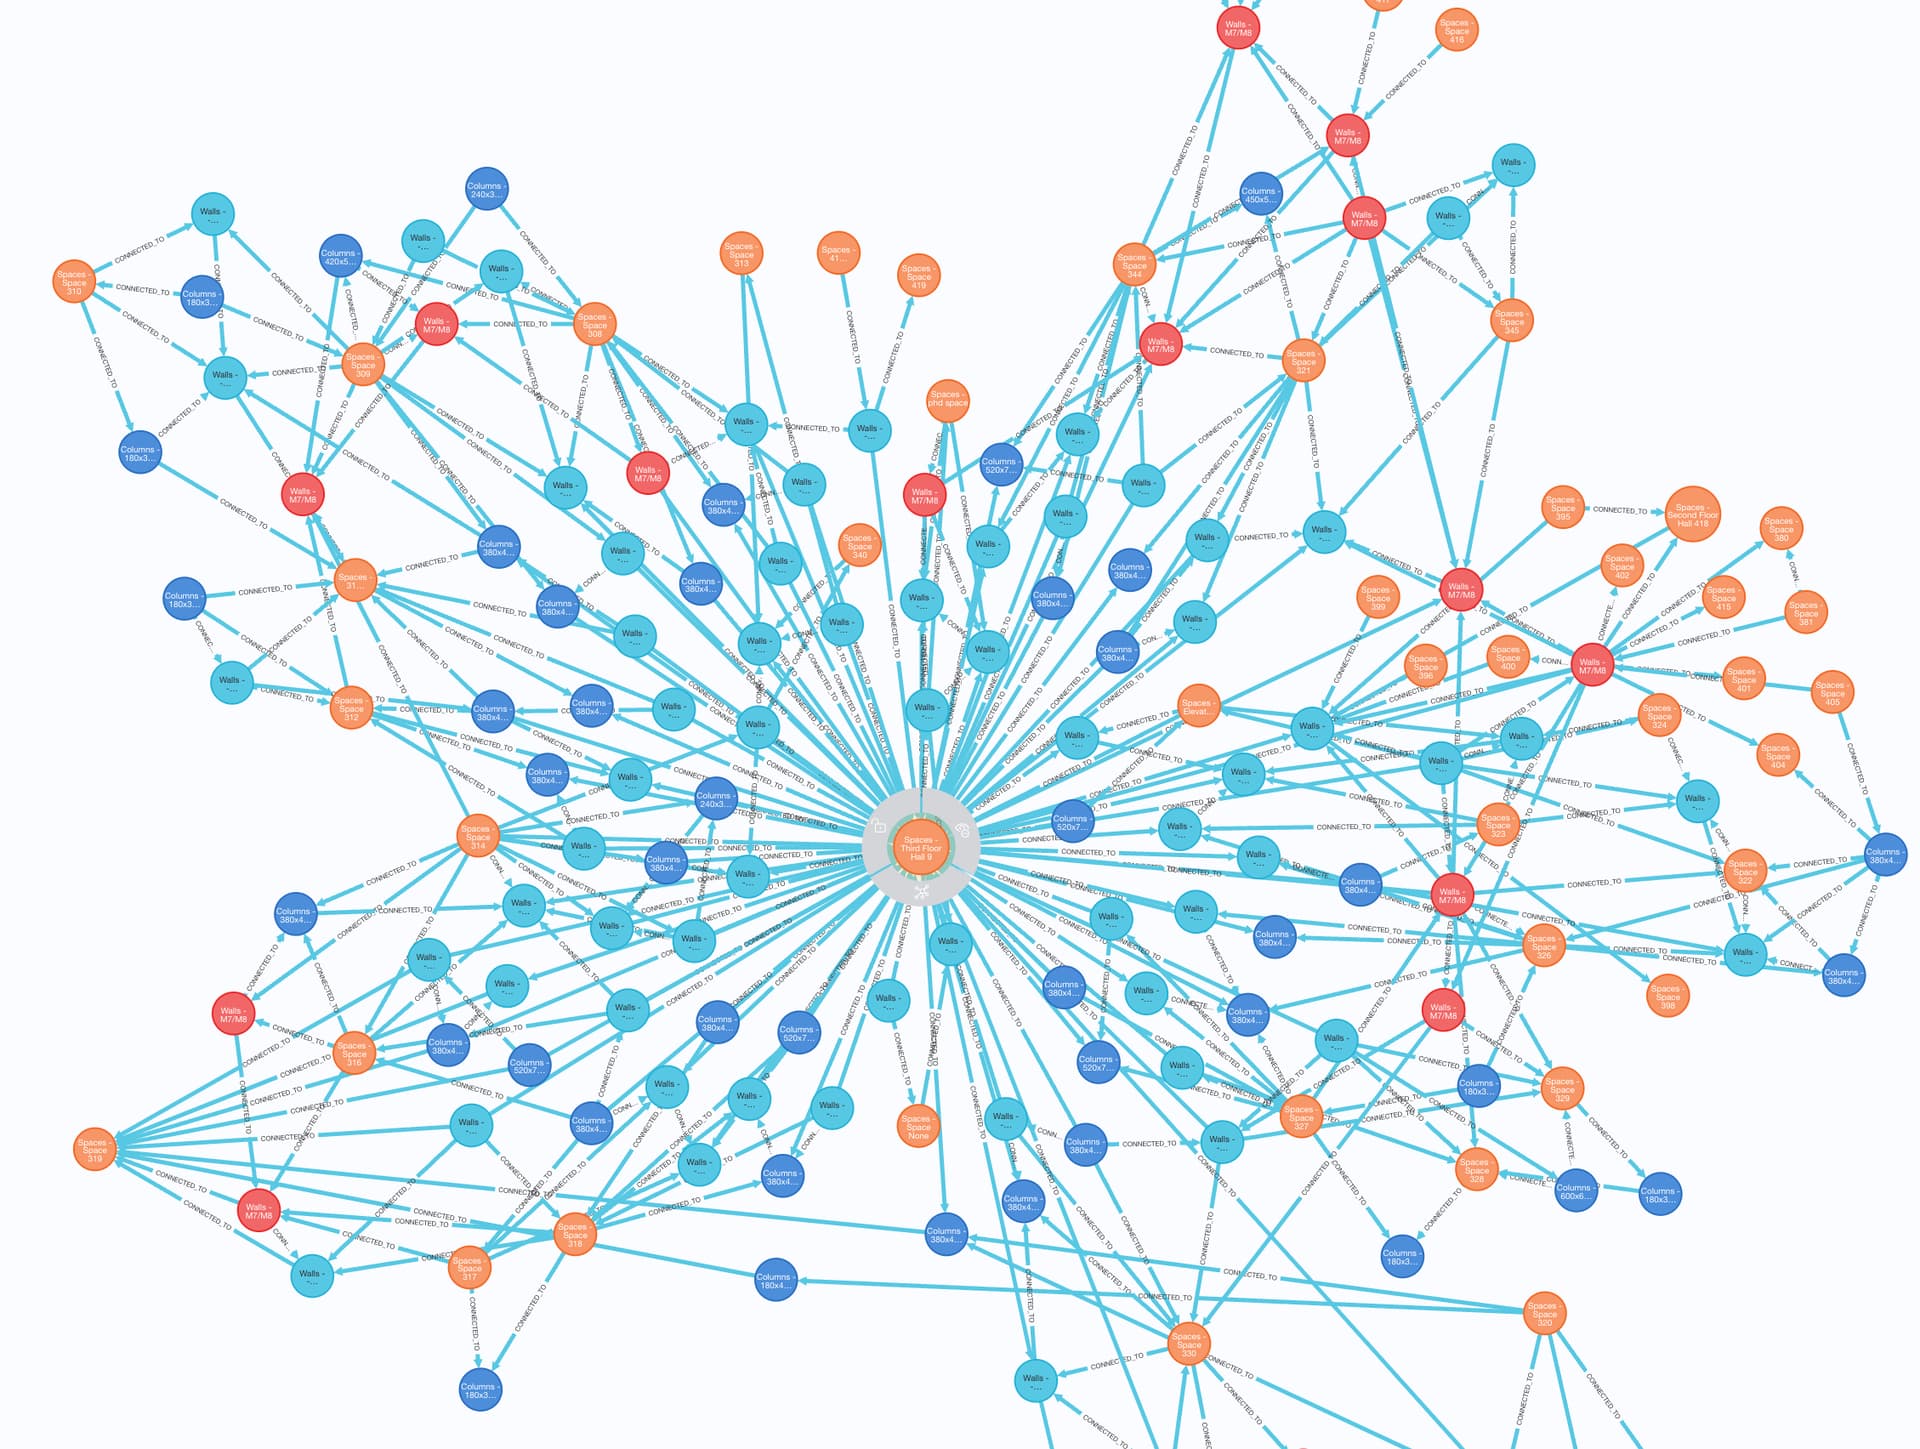
I’ve started experimenting with graphs that I build by traversing an initial Speckle DAG, as well as building all the geometries in Trimesh and capturing the adjacency between them. In order to query this complex graph, I have decided to use the Neo4j graph database and the Cypher query language. Here is an example of part of a graph.
I also find it interesting and straightforward to use a Claude desktop and a Neo4j MCP to manipulate the graph and perform complex queries on it using natural language.
To save time and space in my notebooks, I’ve packaged it up as a Python package and uploaded it to GitHub.
Hello @Willhl, it’s great to see you here! I’ve been following your GitHub for a while, and I saw your Neo4j presentation a couple of years ago. Your work is very inspiring!
Regarding my case study, I am currently focused on the maintenance phase, so I am using the graph not for data transfer, but for data accumulation from different sources, including Speckle. For now, I stick to the official Neo4j MCP servers and use an LLM to populate the missing facility management attributes. I then pass the data, coupled with sensor data, on to ML models that predict indoor air quality and HVAC faults.
So, the graph helps to bring together all the information from the community, such as a room and all its adjacent windows and walls, or from all the components of an HVAC loop.