I want to change the color of 3D model in Power BI however I can only find the background color. No display color setting to add Conditional Formatting. What can i do the change the 3D model color?
I m using the 2.18 connector, sketch up model.
I want to change the color of 3D model in Power BI however I can only find the background color. No display color setting to add Conditional Formatting. What can i do the change the 3D model color?
I m using the 2.18 connector, sketch up model.
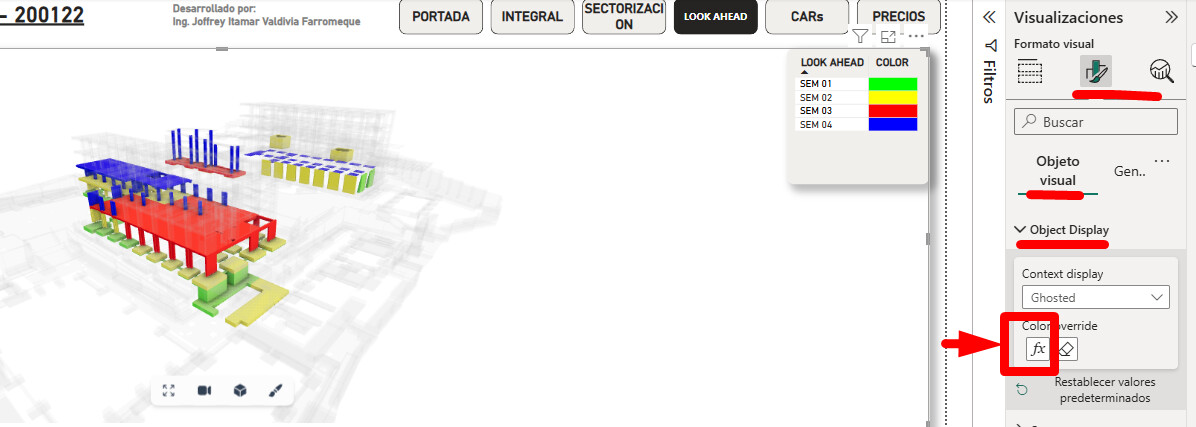
Try selecting your Speckle 3D viewer in PowerBI.
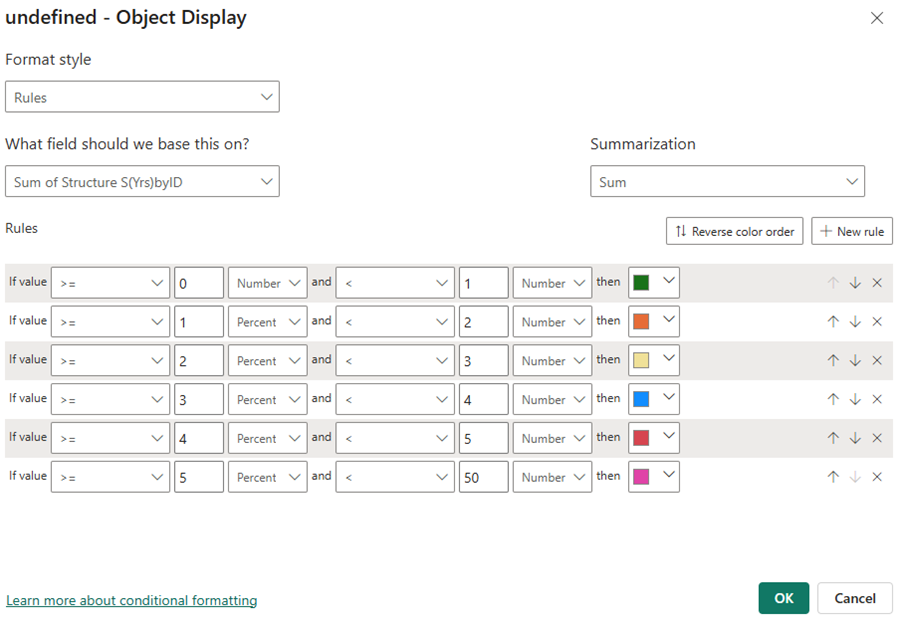
Then go to the second option that is enabled in Displays, go to the Visual Object options and look for Object Display, click on the fx button and from there you can set the colors.
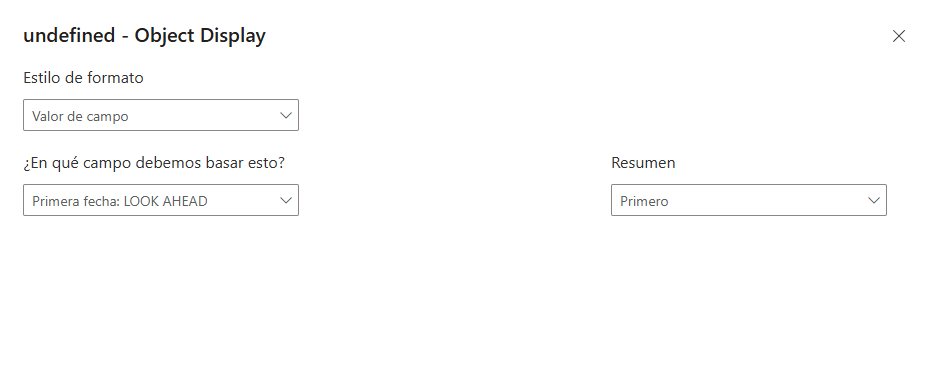
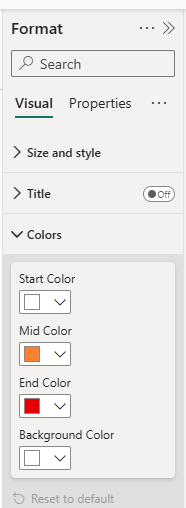
In this new window you can configure how you want to apply the colors to the elements of your model.
Hey @judywu0102 ,
You can learn more about conditional formatting following this tutorial. Let me know if you are still having issues.

Thank you.
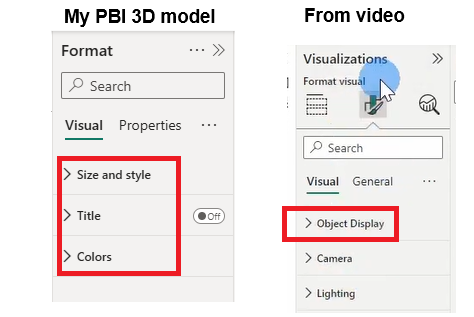
I m unable to find the ‘Object Display’ from my PBI 3D model, do you know how can I fix it?
Thanks
hey @judywu0102,
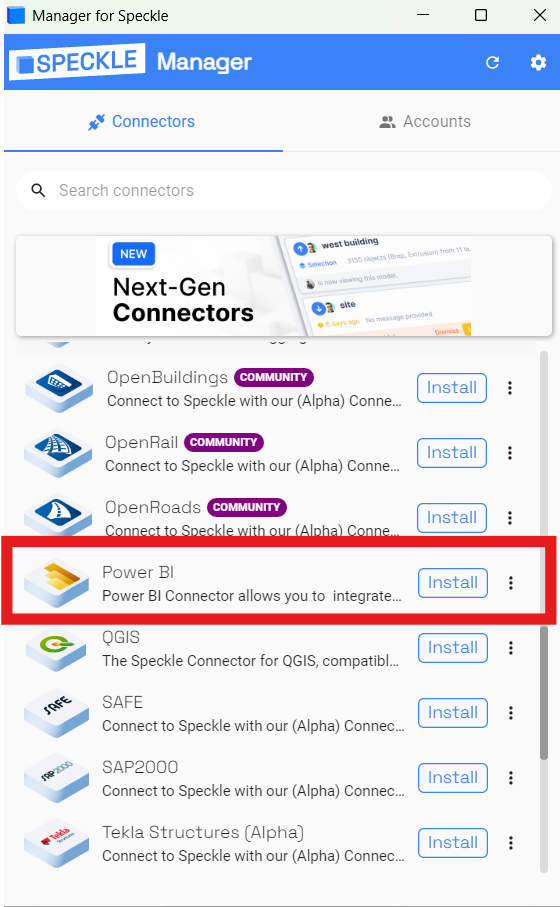
Can you please install the latest Power-BI connector thought the speckle manager?
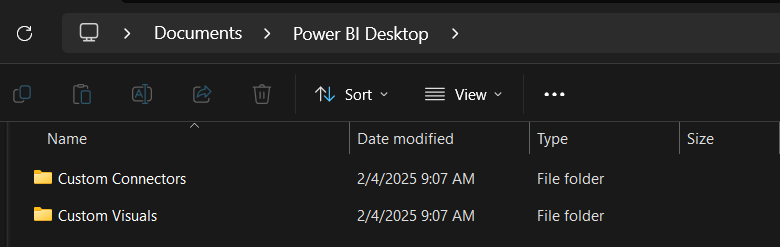
Once you installed you should see two new folders under \Documents\Power BI Desktop
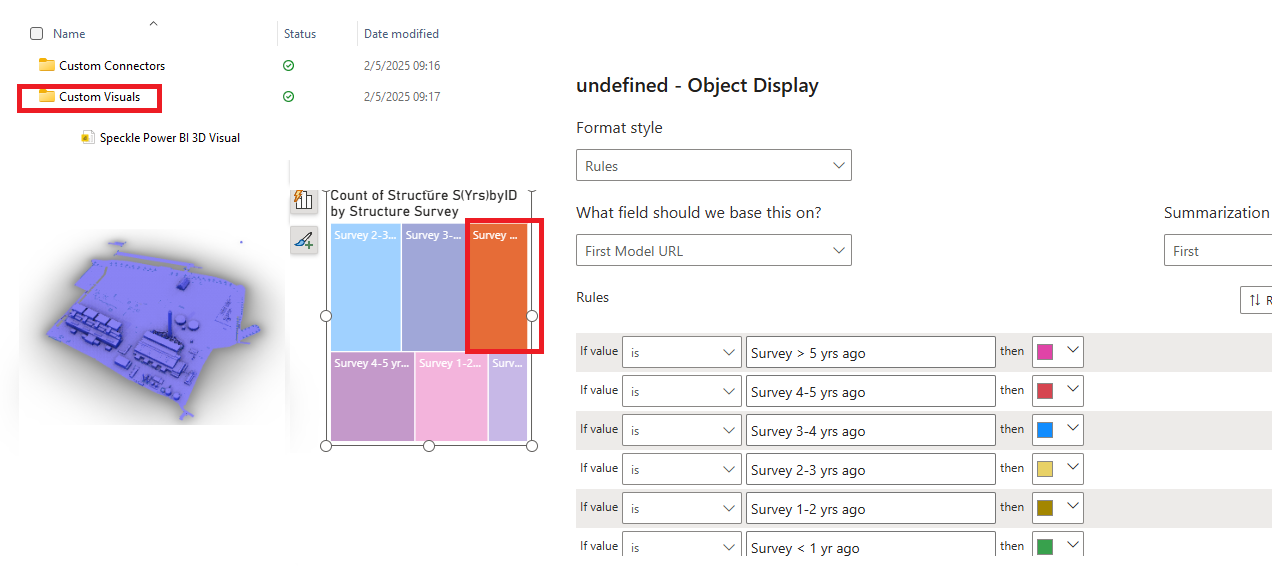
Inside the Custom Visuals folder you can find the new 3D viewer to import.
Try this and let us know if you can see the Object Display.
Maybe you are not selecting the correct visual? Make sure you select Speckle’s 3D Viewer Visual in the dashboard.
Thanks for your reply. I have installed the new 3D viewer and right now I can see the ‘Object Display’ under ‘Format’. Many thanks.
When using the new 3D viewer, the vision shown as one or not shaded the color as set on the backend data.
And we can’t click individual element in the mode, the whole model is fixed as single block
Hey @judywu0102 ,
Good to hear you made it work. Can you share the Speckle Model URL so we can try to reproduce the coloring issue?
I see the model you shared is a SketchUp model. Firstly, i’d like to recommend publishing it using our next-gen connector, which comes installed next to current version.
Secondly, I am having trouble understanding how you created that formatting. It seems you colored them by their “First Model URL” which they all have same value hence they all show up under same color. If you can give more detail on how you are planning to color, what attribute from SketchUp are you going to reference for coloring, it would help us help you.
If what you want to do is select individual elements in the viewer and override their colors with some custom color, that’s not how power bi works.
Thanks for your reply Bilal.
I re do the PBI report. Could you please share me Google drive so I can add the file? The PBI file is ‘AIM 3D model new visual viewer”. My intention was to color the model by Structure Survey by range of the years.
Using the new 3D viewer, I can set the conditional formatting on the Object Display. However the 3D model didn’t really colored in the right places and color.
I don’t know what I did wrong.
The attribute I use for coloring reference is not directly from the SketchUp model. I have modified the data to include additional information tailored to specific use cases, such as Condition Survey, Tree Conditions, Project Schedule, etc.
I will upload the Excel file “model data main” for your reference once I got the google link from you.
Columns A-K contain data from the SketchUp model.
Columns L-V contain additional data that we added, which are not from the SketchUp model.
Will the additional information interrupt the 3D viewer’s functionality in Power BI?
I am unable to select the individual building from 3D model to show tooltip or information on the Table. When I click the 3D model, nothing happen…. See PBI the page: ‘Select the building’. Anything I can do the resolve the issue?
Many thanks for your advise.
Feel free to use the same one as before.
I tried to upload by mobile, seems doesn’t work. Let me try to upload by another device. Thanks
Done and uploaded 2 files to the drive, thanks.
Hey @judywu0102 ,
Thanks for sharing the files. Expanding your data with other data sources shouldn’t break anything. We actually have a tutorial showing how to do it. https://youtu.be/MSZeGlOHcaE?si=W43s_LpwibX10BIv
While having the files help, I still can’t understand how you have assigned these values to corresponding elements. Can you elaborate how you have assigned those values?
In regard to replying to your question about how I have assigned these values to the corresponding elements:
I have tried using both the new connector and the previous connector. You can see the files in the Google Drive.
New connector (Speckle Power BI 3D Visual): It fails to click the specific object from the 3D model. When I click the model from PBI, nothing happens.
Previous connector (Version: 2.0.0-alpha8):
I found that the tooltip can only show the field from the ‘original_raw_data’ when I click the building of the 3D model in PBI. The ‘extra_data’ field name can show on the tooltip; however, it only shows the same value no matter which building I click. Manually typed-in data never shows on the tooltip.
Manually typed-in data is dummy data that I assigned by the object name.
In this case, does it mean manually added data is not allowed to be added and imported to PBI to the model if I want to click the 3D model and show the manually added information? Is it any way to do to solve the issue?
Hi @judywu0102,
As long as you connect these two data sources (Speckle and Excel), I don’t see any reason why it wouldn’t appear as Tooltip Data.
Thank you for providing more details. I will create a simple proof of concept based on what you described, which involves making an Excel table and assigning different values using the name field of objects. I’ll share that with you once it’s ready.
Thank you for your patience!
Hi Bilal, I have uploaded 2 PBI files and 1 Word file with the 3D model link. Thanks.
Hey @judywu0102,
I wanted to share the sample POC I made. I created a simple SketchUp model that consists of four cubes. You can find the SketchUp file here:
16192-sample skp model.skp (251.2 KB)
Here’s the Speckle Model URL: 16192-coloring skp models in pbi - Community Tickets | Speckle
In Power BI, I filtered these cubes and exported the application ID as a CSV file. I added a new column, which I named “judys param,” and filled it with random values (A and B). You can download the CSV file here:
data.csv (63 Bytes)
Next, I imported this CSV into Power BI and established a relationship between two data sources (Speckle and CSV) using the applicationId column as the common link. This step is crucial as it creates a relationship between the two data sources, allowing for seamless interaction from colors to interactivity. Everything seems to work just fine in my POC.
If this still doesn’t resolve your issue, please take a closer look at your data structure. It’s possible that the elements you are trying to color are nested within another component. I haven’t tested whether we support interaction with nested components in Power BI.
Here’s the Power BI file:
16192-sample skp data extension w xl.pbix (927.4 KB)
I hope this helps! Let me know how it goes.