Hi, is it possible to change the color of the object while interacting with the dashboard? (It is for change color based on sensor data ![]() )
)
(For example, each element could have a random color each time a button is pressed)
thank you!
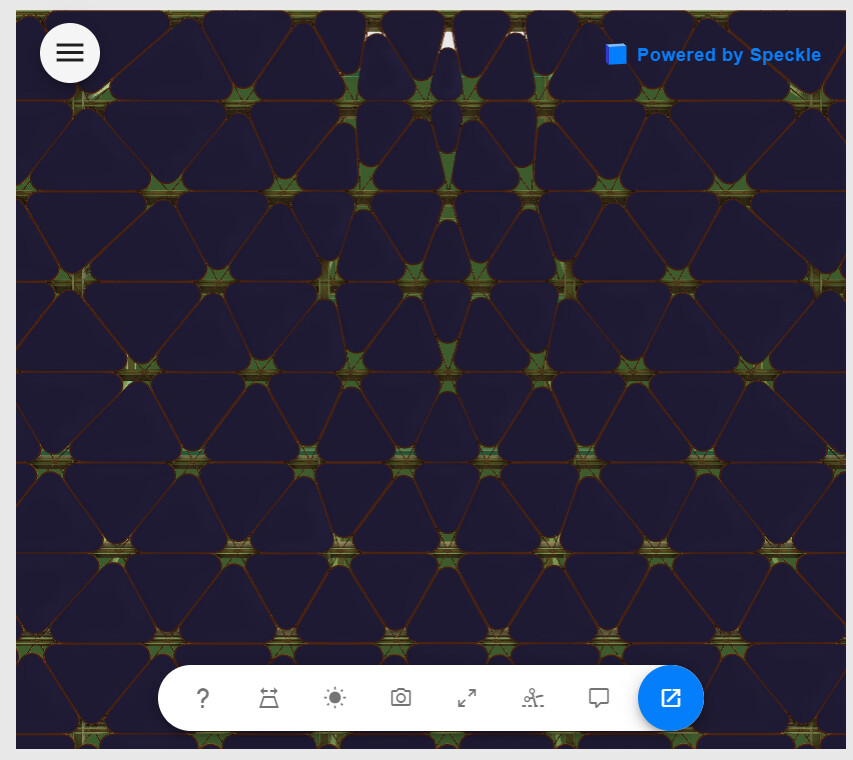
Assuming you are using the Speckle embedded viewer, this makes it possible to highlight different elements as you would in the Speckle front end.
If you use the Filter Groups option, there:
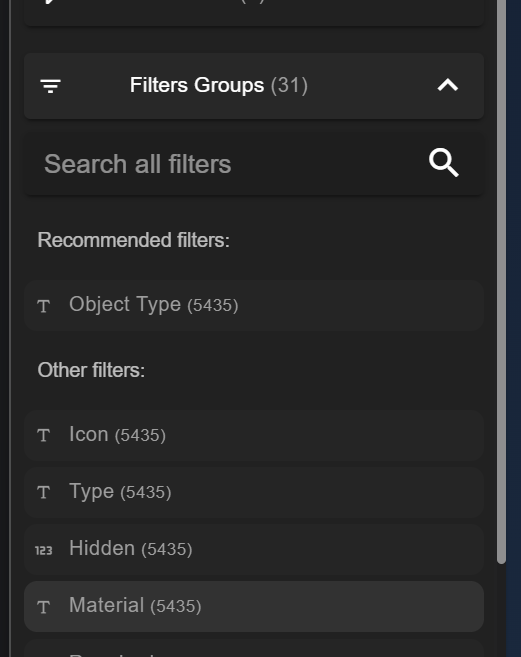
Select a Property to group by:
You’ll see the main browser URL contain:
?filter={"propertyInfoKey":"Material"}
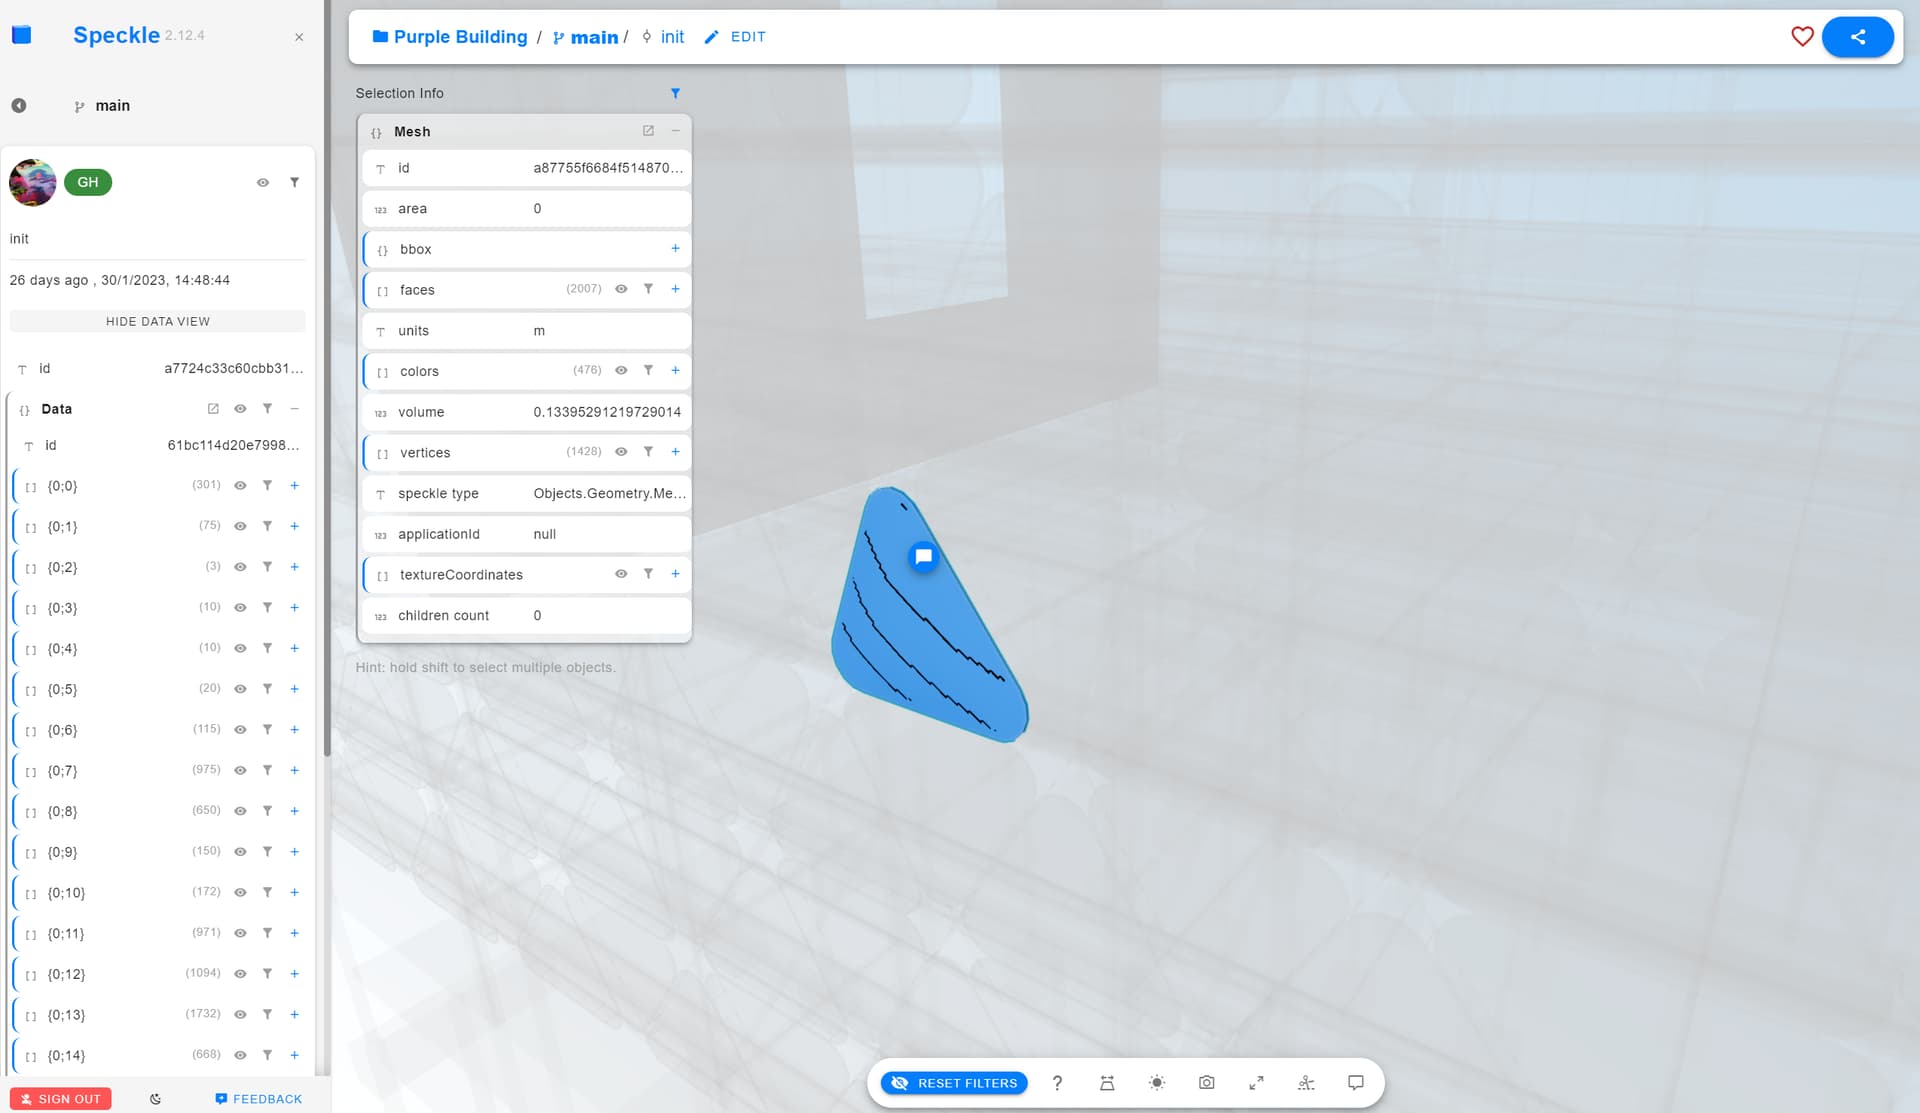
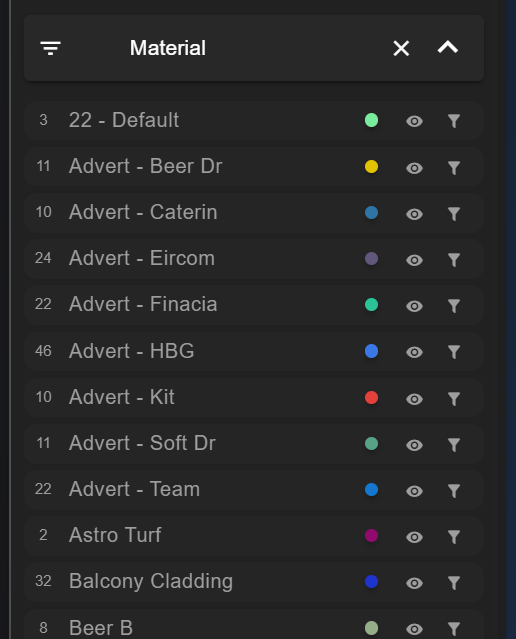
and the Model Version you are looking at will be colored accordingly:
You can therefore amend your python dashboard generation of the embedded viewer URL to include the same parameter or any other that you want to group by.
There is no instruction you can pass to specify the colours used at this time. We don’t have any examples that directly use a plotly output for Speckle data, but if you do, I’d love you to share it.
1 Like
wow looks amazing yeah kind of but can this be updated on the fly?
Our goal is to plot the sensor data to the façade model and plans, so it needs to be updated ~every hour, so maybe it’s possible to extract the element-specific attribute and modify the color value?
The mechanism here is that the Speckle Data would be augmented and committed to the server as new data is generated.
Using python:
- Receive new sensor data
- Receive the Base Geometry model (e.g. Base Model Branch)
- Edit the property for each affected Object
- Commit the new objects (e.g. Digital Twin Model Branch)
- Update the embedded viewer by refreshing it. Or, to a defined point in time, a specific commit
The 3D viewer URL can be set to show a stream’s latest version rather than one particular commit.
1 Like
yep, i was thinking about this right now
thank you so much!
1 Like