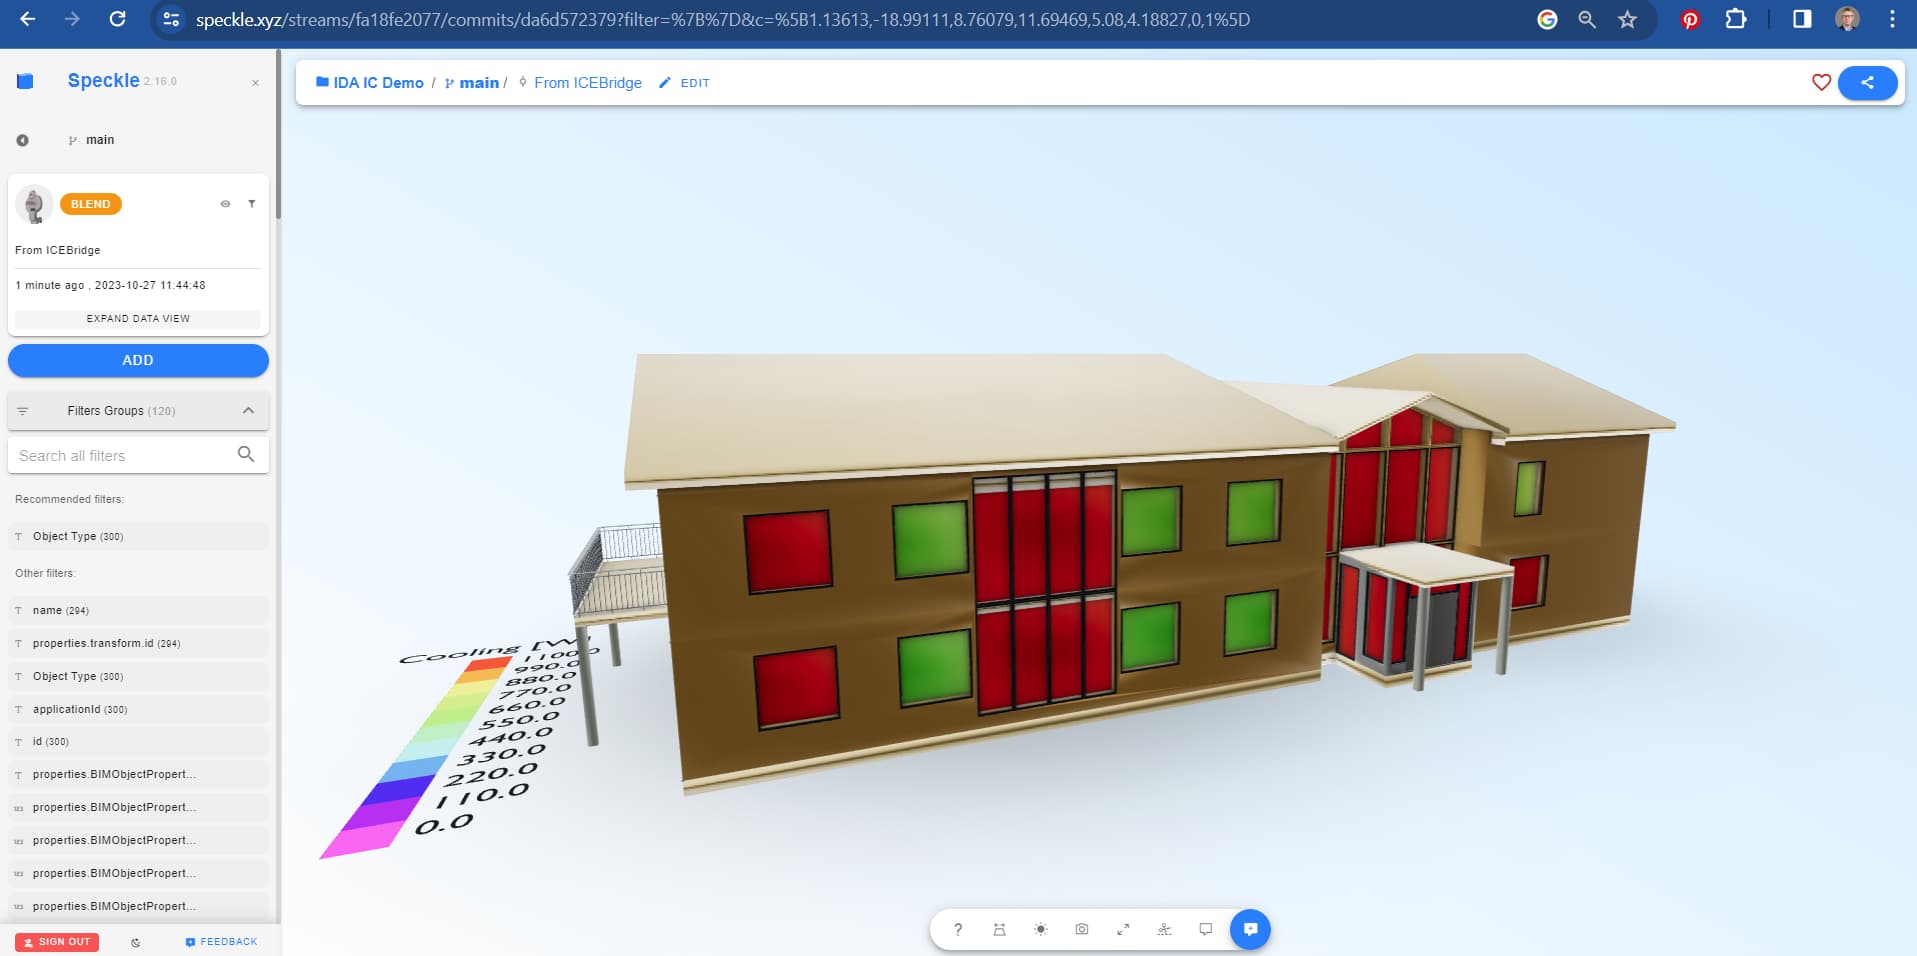
With some external post processing I used the Speckle viewer as dashboard to present simulated result as cooling power per zone, energy usage and thermal comfort. Simulation performed in IDA ICE. Model can be found here https://speckle.xyz/streams/fa18fe2077/commits/da6d572379
Cooling power with imported color scale and fixed colors:
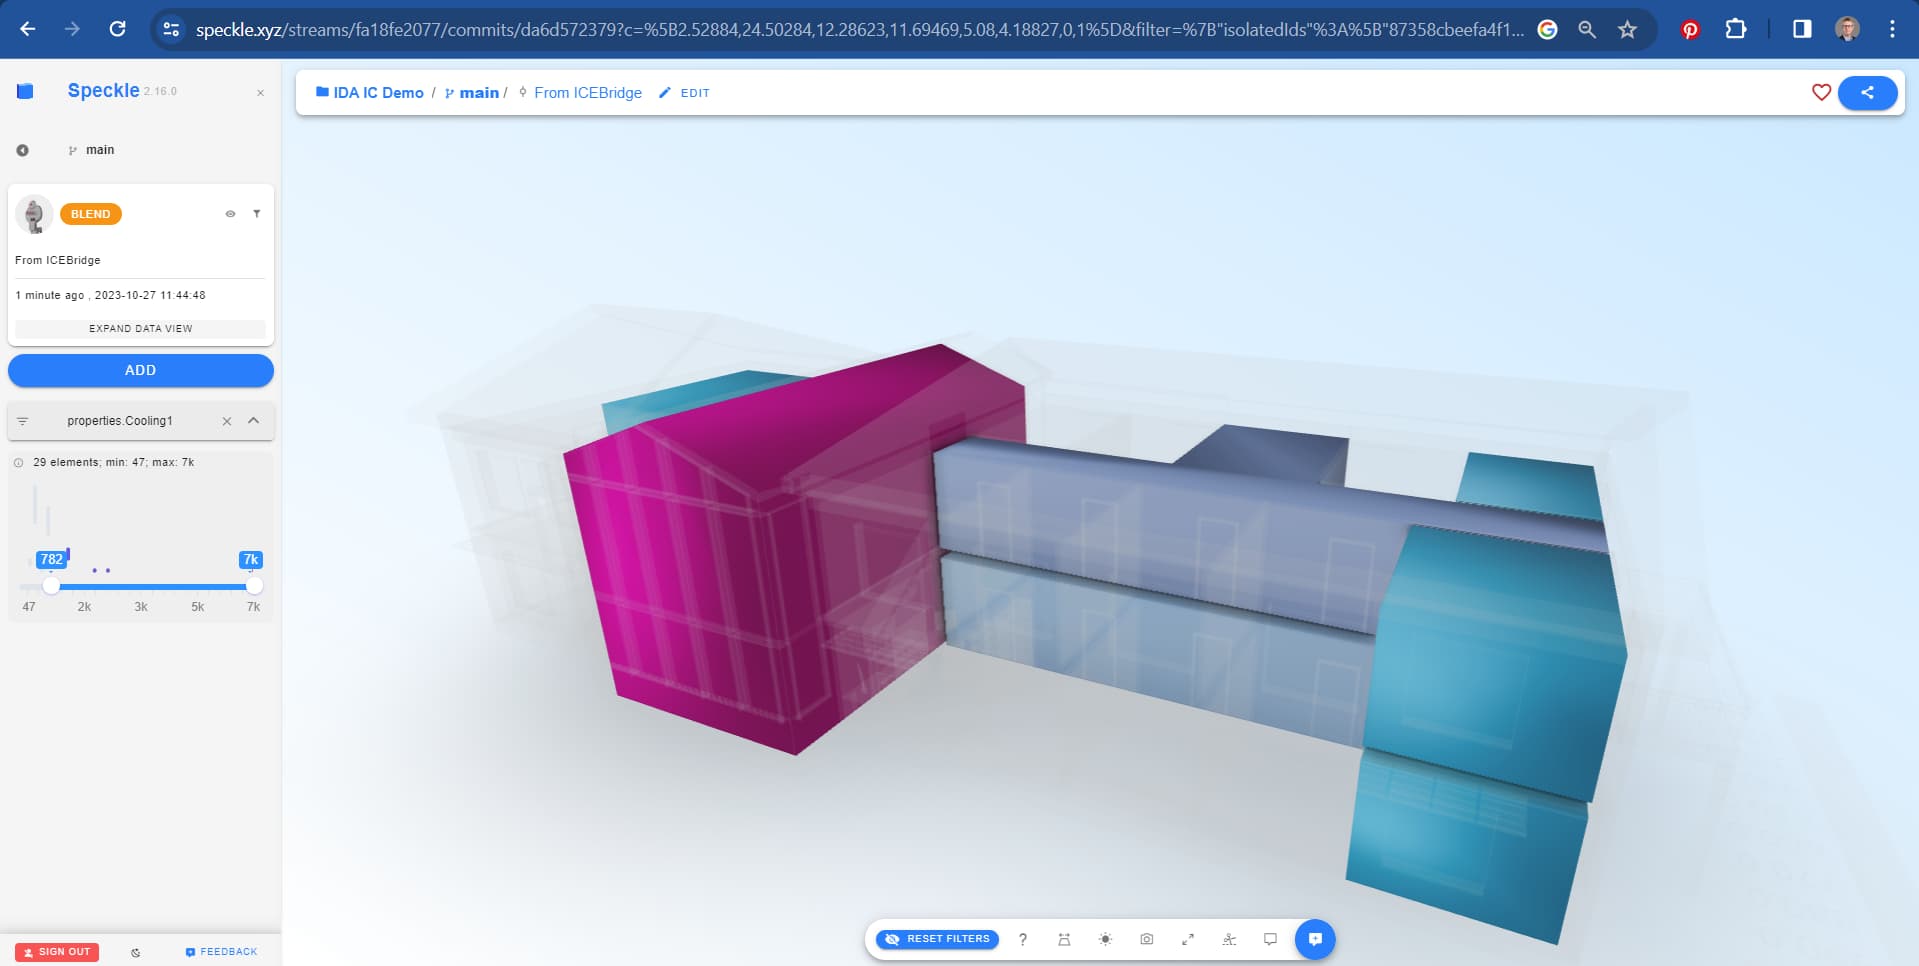
Cooling power using filter
The process was:
IFC->IDA ICE using IDA ICE Bim import
IFC->Blender using BlenderBIM
Result from IDA ICE->Blender using CSV syncing data based upon IfcSpace Name
Post process data in Blender using ICEBridge
BIM+Data->Speckle using Speckle plugin