Hi, I am new to speckle and trying to workout if the following exercise can be done using Speckle.
It is possible to take data from an excel file and use it to colour code a 3D model from Revit and push the colour coded model into Power BI?
I have a project where we are tracking the off site manufacturing process of a building element and would like to know if speckle can be used to update the 3D model by colour coding the building element based on the status/hold point as it goes through the process of fabrication to installation on site.
I’m thinking of two main ways to achieve this, please not that I haven’t tried them and maybe @gokermu can help with a small proof of concept
Send from Revit to PowerBI and from Excel to PowerBI and associate the elements by their ID, you should then be able to color them in PowerBI by your field
Send from Excel to Revit to set a parameter on each element with a value you want to color by, then Send from Revit to speckle and load the model in PowerBI. This way, you can also color your model in the Speckle Viewer by the same property.
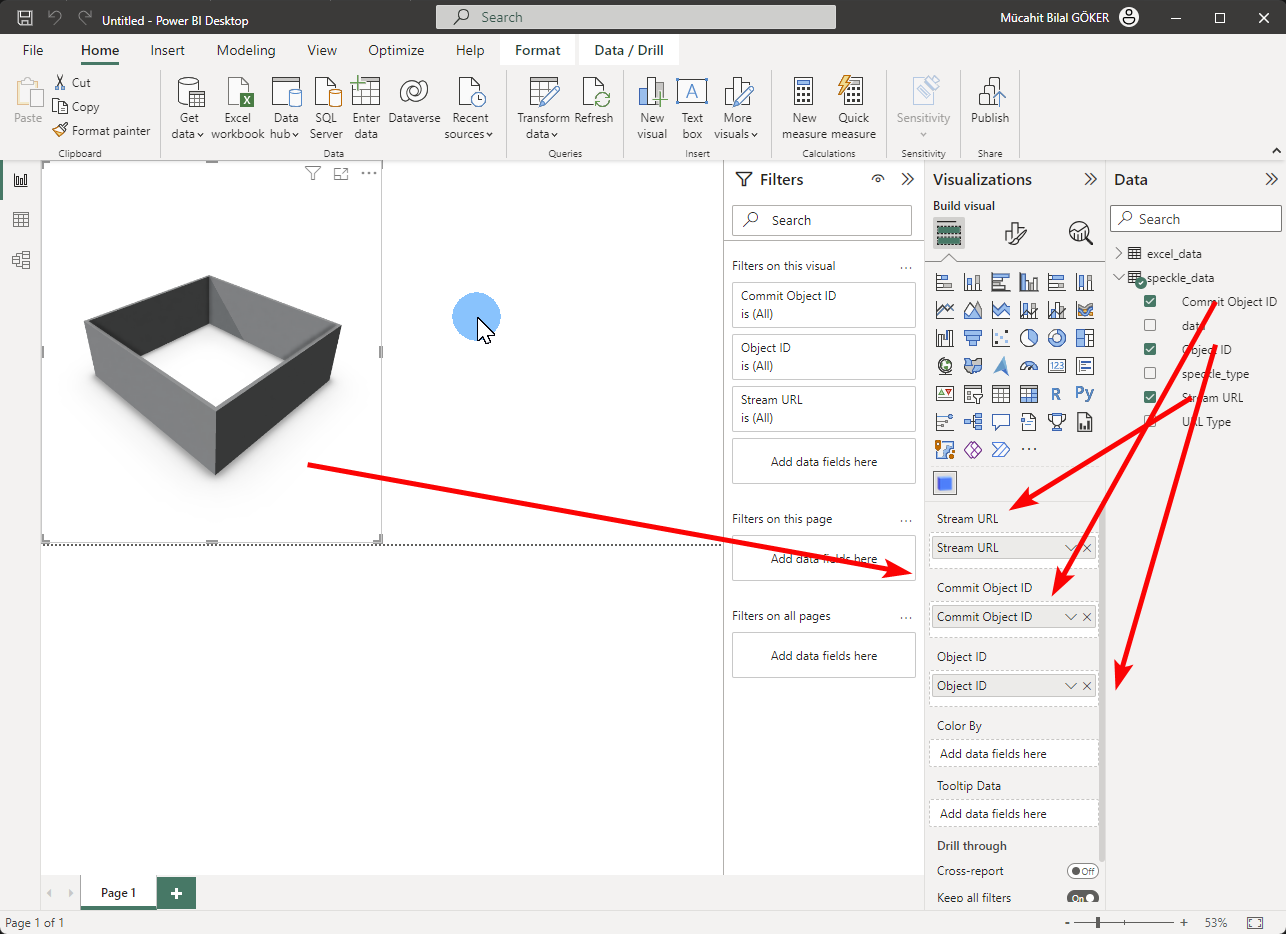
I wanted to revive this topic. Previously our viewer did not relate excel data with the objects in the viewer. But we recently added support for this functionality along with many other improvements.
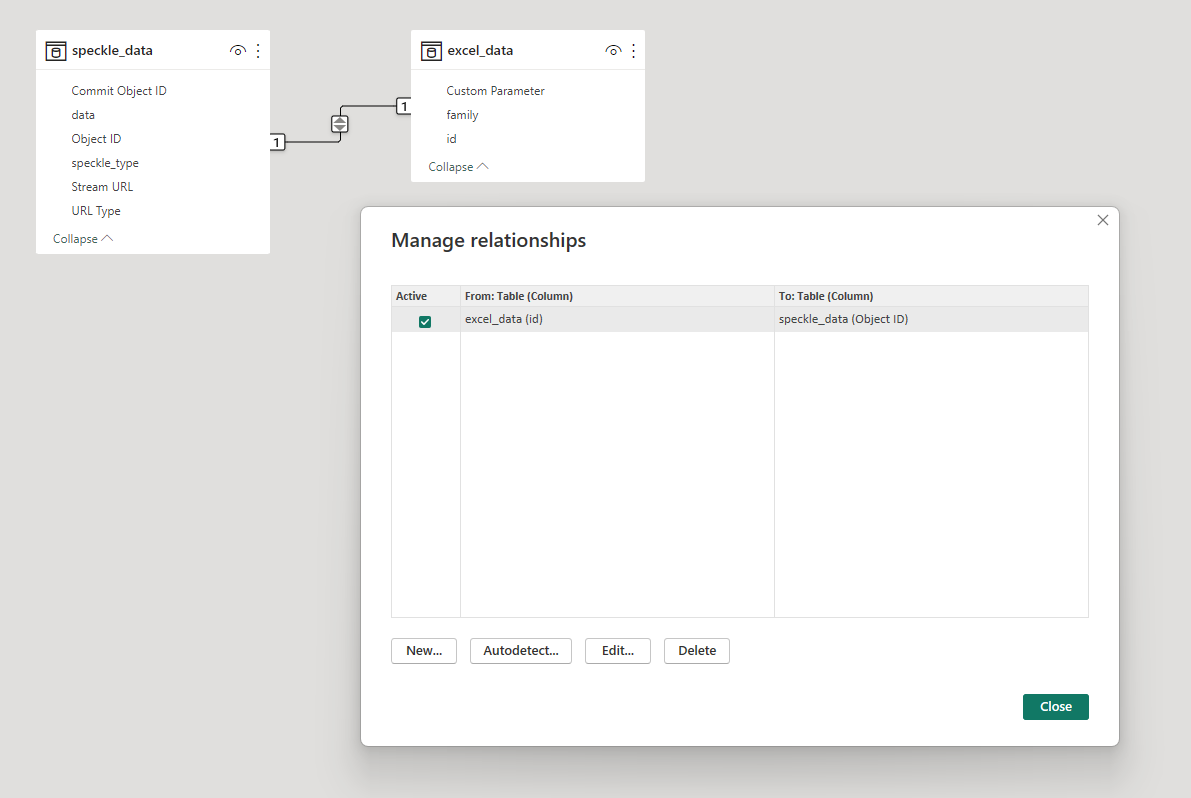
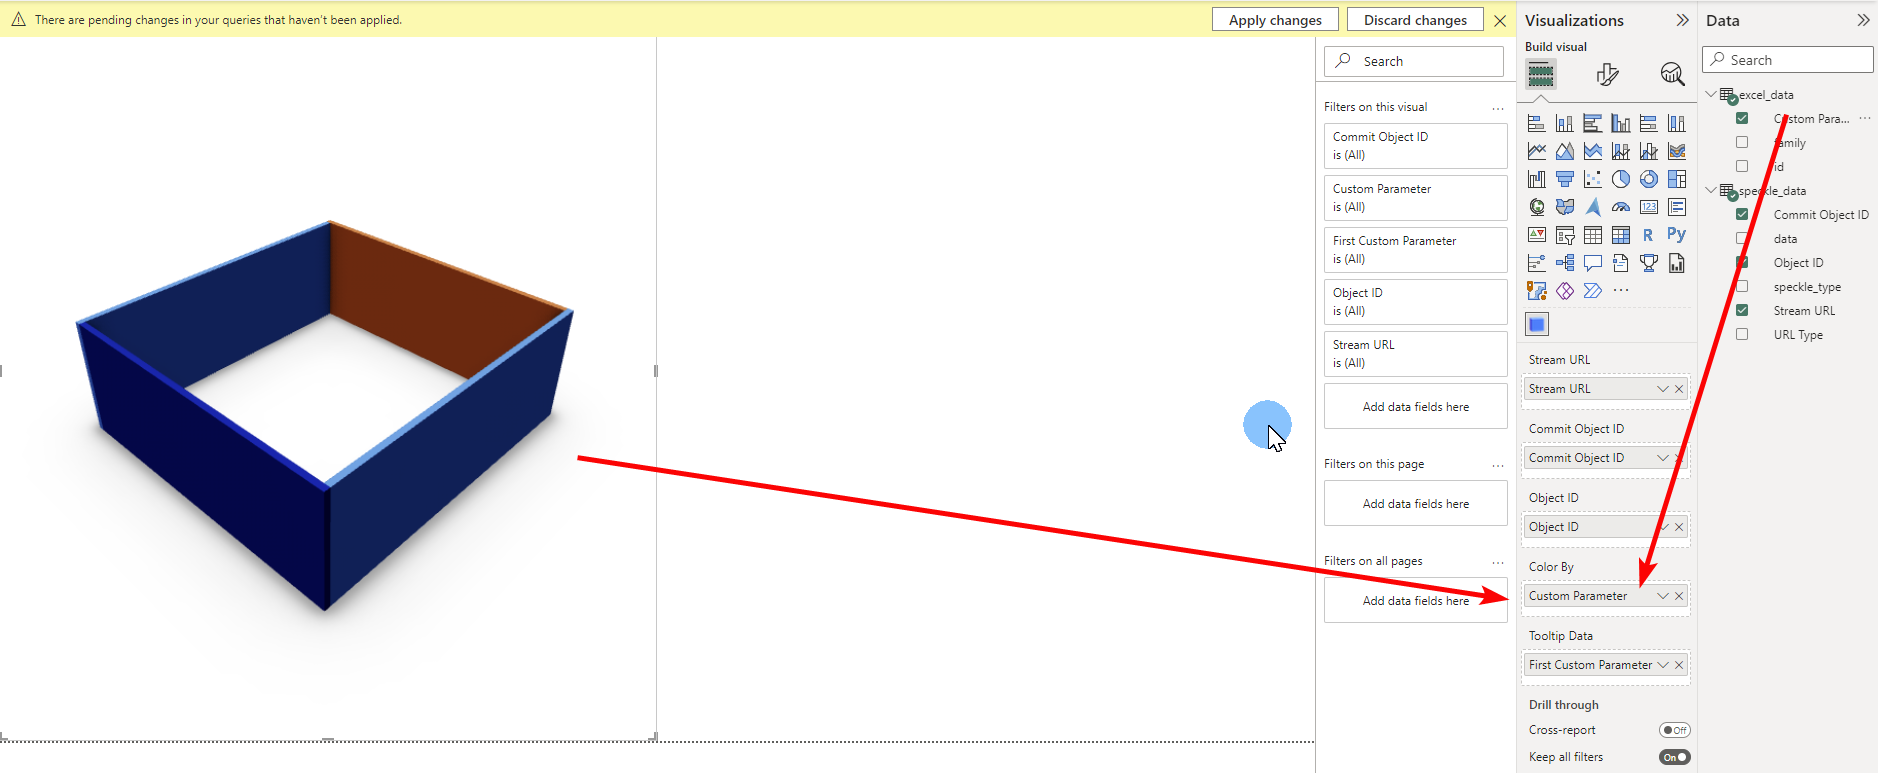
As suggested by @teocomi, we can establish a relationship between the two tables using the IDs (or any other parameter tbf). Let me illustrate that with a simple example:
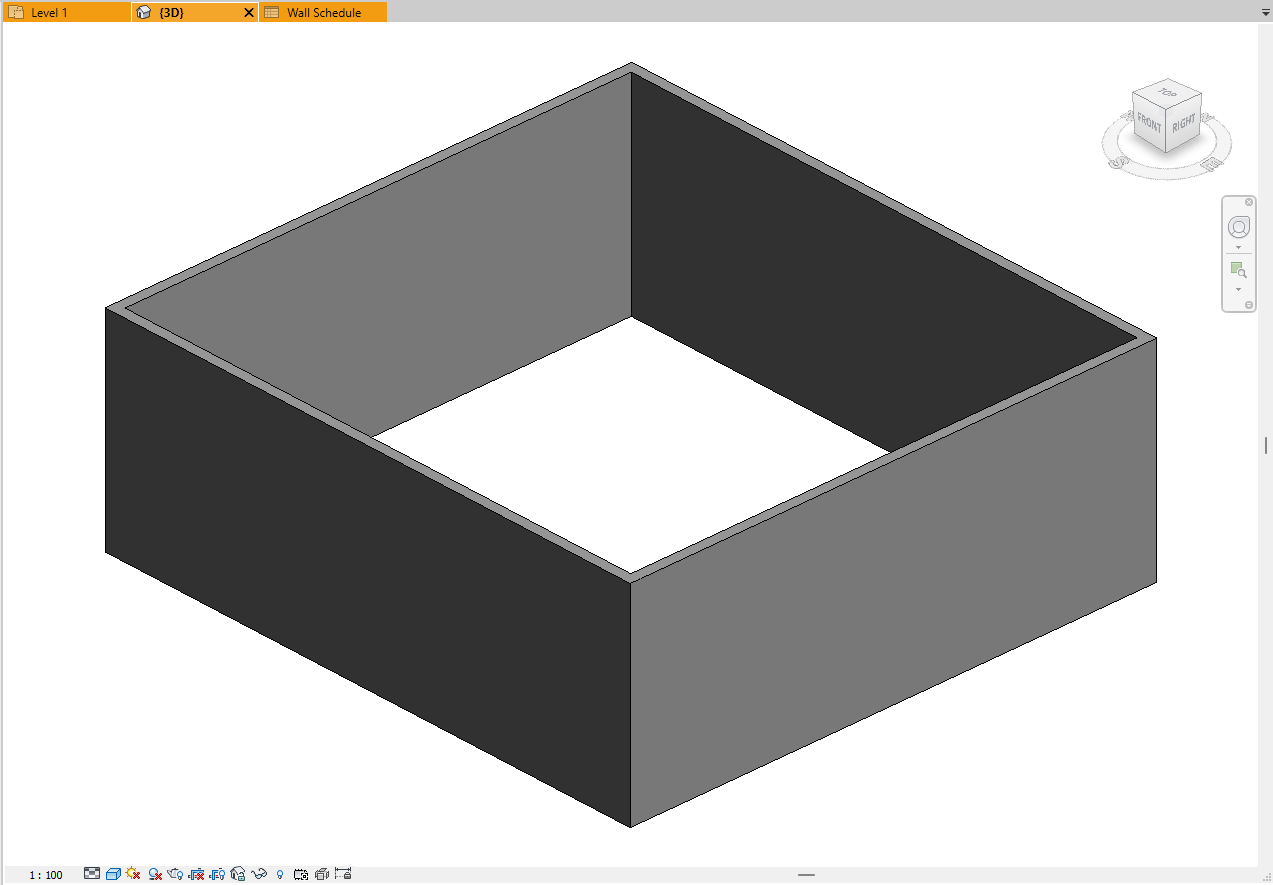
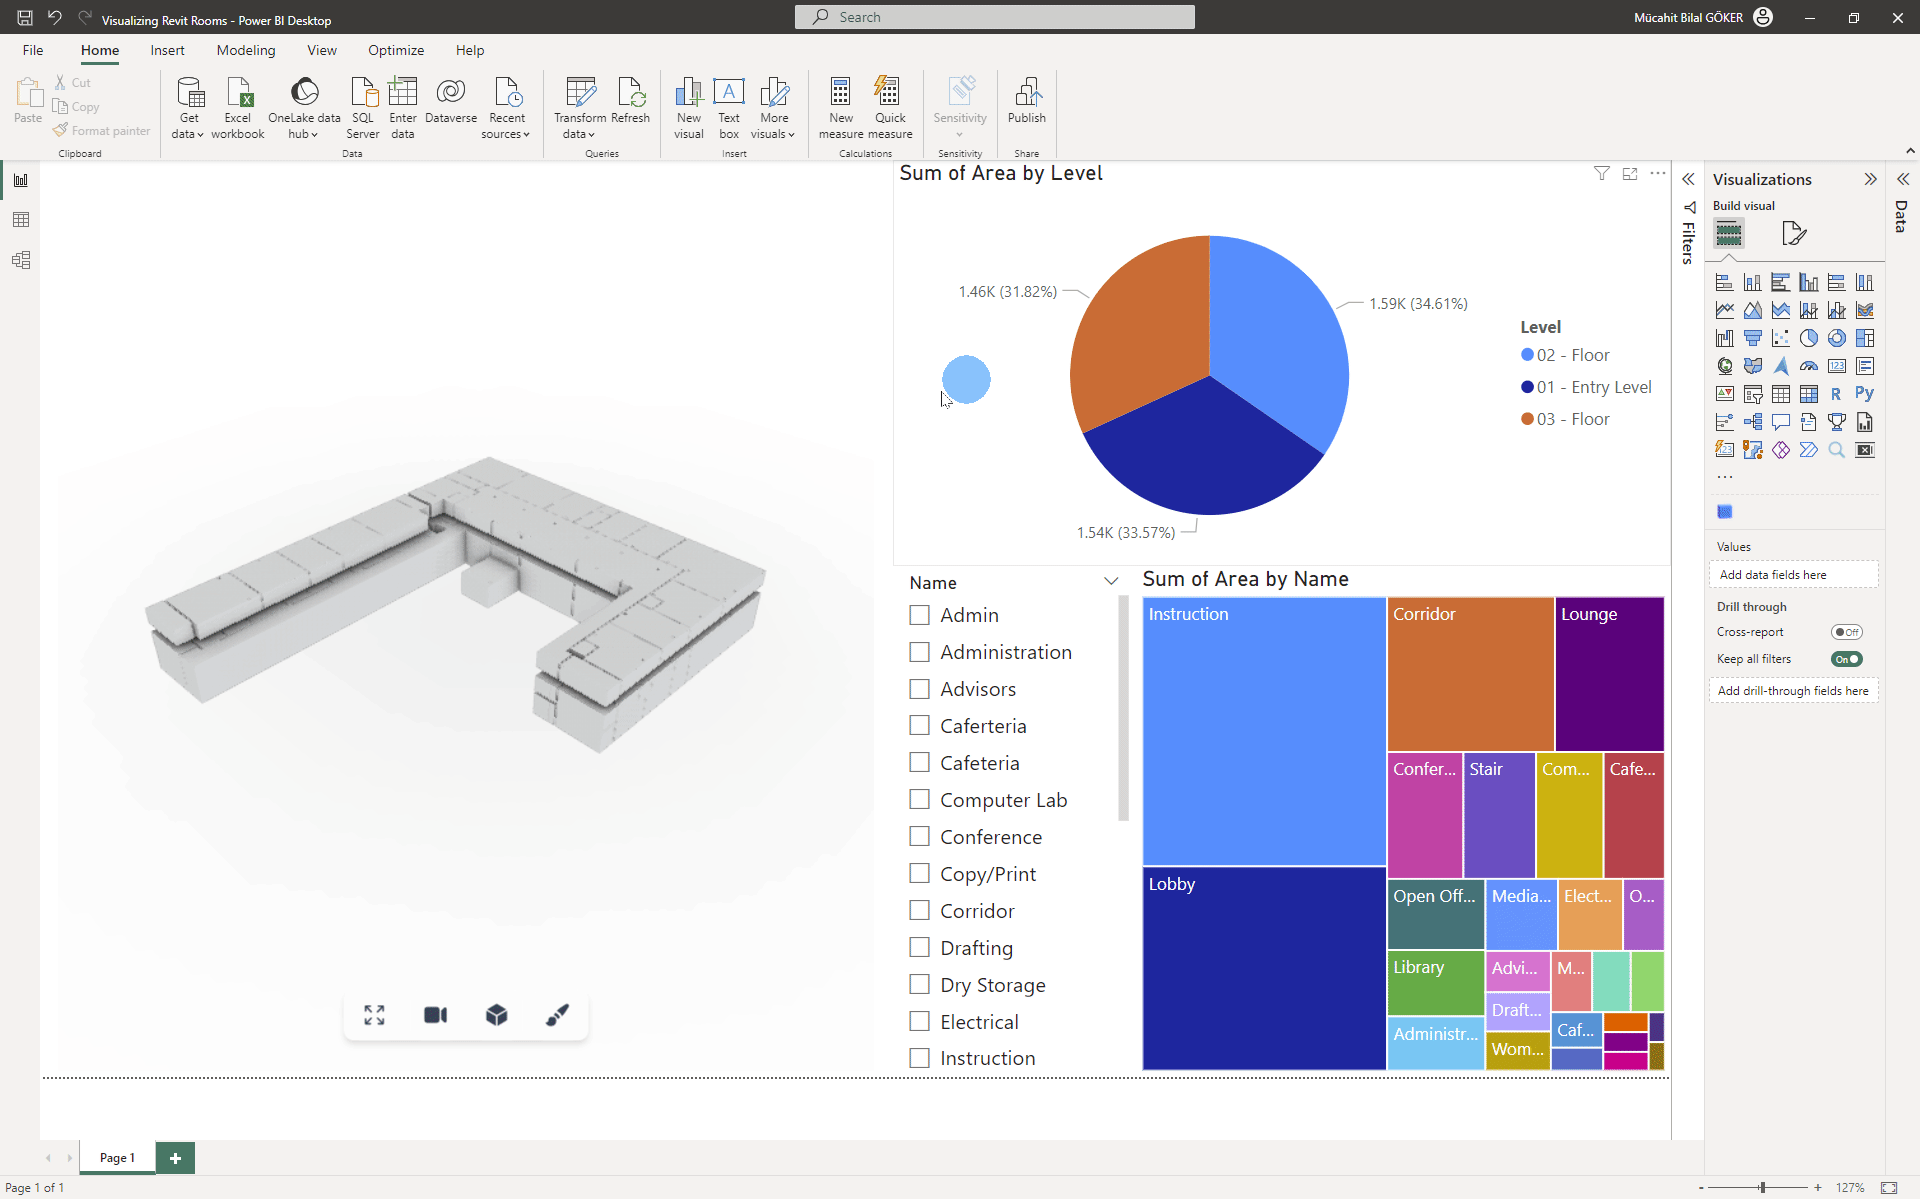
Imagine that you have modeled 4 walls in Revit. Using our Revit connector, you can send these walls to Power BI and visualize them using our 3D Viewer Visual.
So, we can create a relationship between these two queries using the id columns. (Note: You can use any column to relate two queries. If you want to learn more about relationships, you can check out Power BI’s documentation.
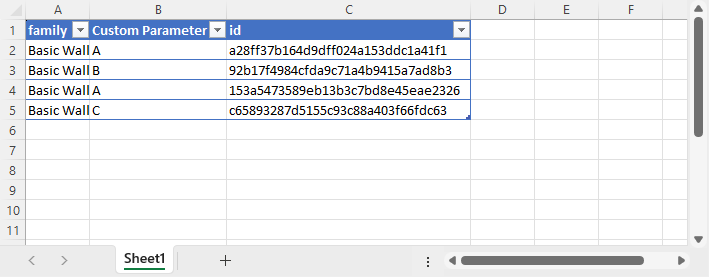
Now that we have established a relationship between the two queries, we can now color objects by any parameter we want. In this case, I colored them by the Custom Parameter column. (Please check the table above, you’d see two walls had the same Custom Parameter value **A**. And in our 3D Viewer, two walls share the same color.)