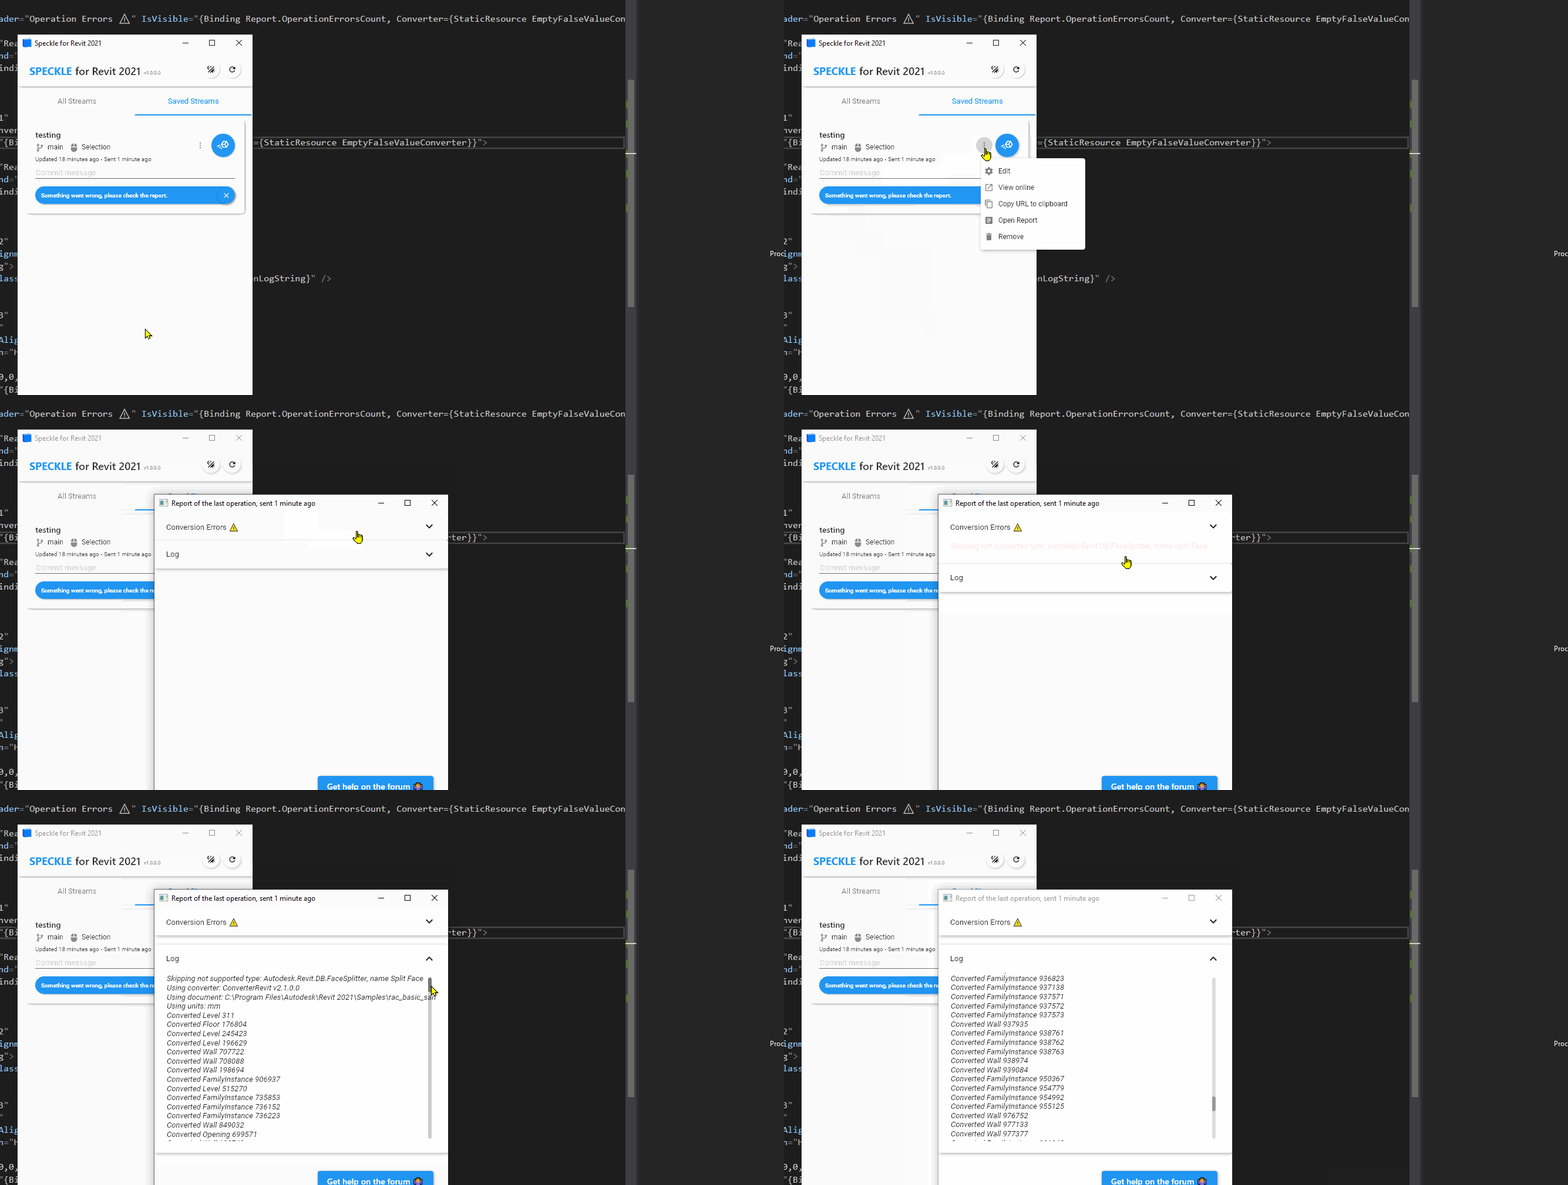
I’ve been running some small tests with the Revit client (using data created by Grasshopper), and I’m loving how smoothly the update procedure seems to be going.
I personally like to receive a lot of info on what exactly a script is doing in the background (it boosts confidence in the app): for example in Revit, which elements are being created, which are being modified (+ type of change), and which are being deleted. And most certainly, for which elements something unexpected happened…
Do you see value in creating detailed logs about what the Speckle clients are doing to the host apps model (possibly as tabular data for easy searching and filtering)?
Yes, I like the idea!
Maybe a first start would be to just dump all the info in a log file where advanced users can have a look? Or is there already such a log file?
Hi there! Sorry for the delay on jumping into this…
We currently log a bunch of stuff into Sentry, but as you’ve already seen, it’s mostly for exception related issues, and things get logged (and anonymised) to our private Sentry so none of you guys will actually be able to see any of that.
I think some sort of log would be a great addition, so I’ll discuss it over with the team to figure out if/when/how to fit it in our roadmap.
Just to expand this discussion further. What would the ideal solution be for you guys? Since nothing is coded feel free to propose anything!
Would a single log file where everything get’s dumped work for you? Or would you rather have “per connector”/“per stream” logs?
I also think some of this information (elements updated, deleted, skipped etc) would be useful to many end-users, so it could potentially be good to expose it via DesktopUI as well.
What do you think?
Ideally a user would have a nice desktop UI with an overview of what happened in the send or receive process. So yes, how many elements were successfully send/updated/received, what errors or warnings occurred, etc.
It would be good to save this data in a log file so it could easily be checked by others afterwards. Maybe you need a log file per connector because you could be brave and try to send and receive data in various software simultaneously. This might result in both connectors writing to the same log file at the same time, which could be messy.
Yes, exposure in the desktop UI will surely be useful. A well-informed user is a good user. Indeed you could add a summary of amount of elements that were created / deleted / changed / skipped, and expand these to list all elements with their Ids (perhaps grouped by category, …). To make it fancy, you could perhaps add a link for each element that allows you to immediately zoom into it in your view (similar to the Dynamo Player).
I agree. If it is stored as tabular data then I wouldn’t split it up too much. A big table is always easy to filter through using Pivot Tables and simple to plug into dashboards to make some neat charts.
Hi @teocomi
At first sight it is looking good! When I get the chance to try it out, I’ll certainly get back to you.
Can you export the log, or is it available as a file somewhere?
This looks really nice! Great stuff!
Maybe in the log add a time stamp (sometimes if there is a long time between 2 actions it can help to see where it went wrong)?
Sorry I have been a bit busy lately, but hopefully I soon have some time to check it out and maybe share some more feedback.
I finally had the chance to test the new UI in Revit, and I’m a fan. Use is very intuitive, I like the added clarity when selecting streams and branches from different accounts.
I also encountered a bug… When sending the analytical model of a structure, I received an “Object reference not set to an instance of an object” error, which is all that appears in the log. Nevertheless, I did manage to send 247 out of 248 elements. The problem seems to occur with an Analytical Foundation Slab.
Hence, would it be possible to solve this error, and if an error does occur, to make sure that the successes are still listed and more info is given in the log about which element has failed?
I think some of the logging logic didn’t make it to some of the latest conversion routines that @Reynold_Chan just added. We’ll do that asap and also look into the failing slab, any chance you can pinpoint it and share it with us for some debugging?