Hello there! I thought I might get this going with an fun little project I did shortly after learning about the wonders of Speckle ![]()
About a year ago, I built a prototype tool for helping mechanical and electrical engineers working on data centres. Data centres are hectic projects to work on with equipment layouts and numbers changing constantly. Every time this happens, key performance indicators need to be calculated from the updated Revit model, adjustments must be made if any numbers are unsatisfactory, and the results must be laid out in a report to present to the client ![]()
Counting up equipment numbers, pasting them into excel spreadsheets, calculating the various KPIs, and pasting the results into a word document was unnecessarily claiming a lot of engineering time and brain power. This time suck was compounded every time the KPIs did not meet requirements and the whole process needed to be repeated ![]()
To make this easier, I built a Revit plugin (using python ![]() ) that could take care of this! After the adjustments are made in the Revit model, all the engineer has to do is press the button in the Revit toolbar. This opens up a modal where the engineer enters some global parameters for the data centre. The tool then counts up all the relevant equipment in the model, calculates all the KPIs, and pushes the data to a Speckle stream
) that could take care of this! After the adjustments are made in the Revit model, all the engineer has to do is press the button in the Revit toolbar. This opens up a modal where the engineer enters some global parameters for the data centre. The tool then counts up all the relevant equipment in the model, calculates all the KPIs, and pushes the data to a Speckle stream ![]()
The great thing about using Speckle here is that the data can easily be received by whoever needs it. Other engineers can pull the values into their various Dynamo/Grasshopper scripts, excel spreadsheets, or simply view the stream in the speckle web app to inspect the results.
Edit: here’s how Izzy’s stream would’ve looked like when received in grasshopper > this section of the docs shows how to create streams online, which is as close as you get to what Izzy was doing via Python if you don’t know Python; at the end of the documentation you’ll see a purely “analytical” stream received in Grasshopper.
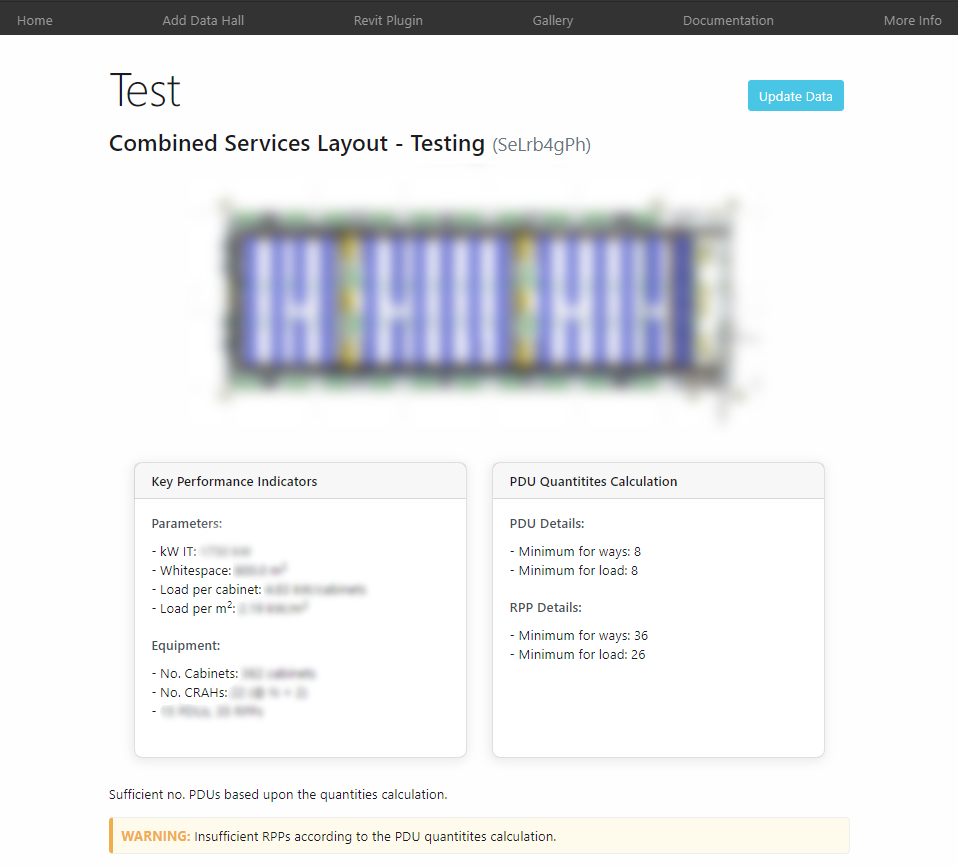
It also meant I could build a simple web app to clearly display the KPIs, equipment numbers, and flag up warnings if the KPIs did not meet requirements. This web app was also written in python (I love ![]() ) using Flask. I also managed to add an option to download a micro$oft word document of the results (using jinja templating) that could be polished and handed off to the client. A boring process that could end up taking a day or two could now be done in just a few minutes
) using Flask. I also managed to add an option to download a micro$oft word document of the results (using jinja templating) that could be polished and handed off to the client. A boring process that could end up taking a day or two could now be done in just a few minutes ![]()