I am trying to do a keep it simple web app that showcases a project and data analytics on a AEC website (just as proof of concept - but hope to get work with it).
The plan is simple:
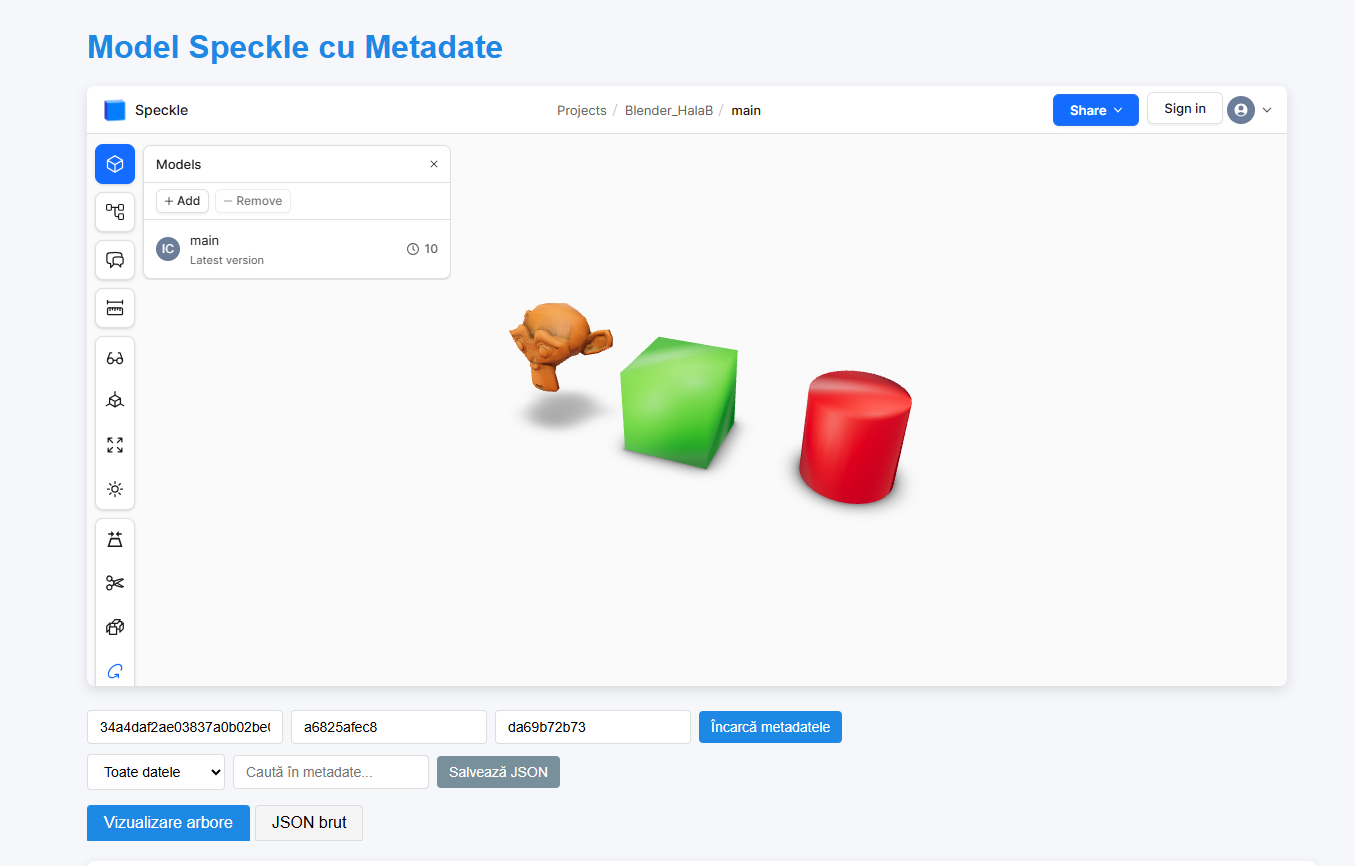
Embed the speckle viewer;
Query the database;
Let the user to view his project ;
Kind of a powerBI in the browser.
Sounds like a cool project! To make the Viewer interactive with the Data you probably need to use the Speckle 3D Viewer. You will find plenty of examples to get started.
I’ve got happy when I saw how simple one can embed a speckle project with the viewer in a simple htlm app. For the dashboard to be interactive, I saw some python examples in the docs.
Fun!