Hi, I am working on creating automation tools be utilizing Speckle as a data center for ETABS.
The workflow is using data from ETABS to plot building response charts on a web application. I notice data coming from ETABS is similar to ETABS tables, so I hope I can have these results in the analysisResults object
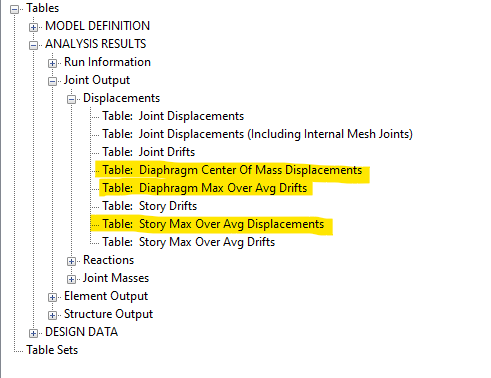
I believe these charts are corresponding to these charts in ETABS
Diaphragm CM displacement chart--> Diaphragm Center of Mass displacement.
Diaphragm drifts chart --> Diaphragm Max over Avg Drifts
Max story displacement chart--> Story Max Over Avg Displacement.