Example
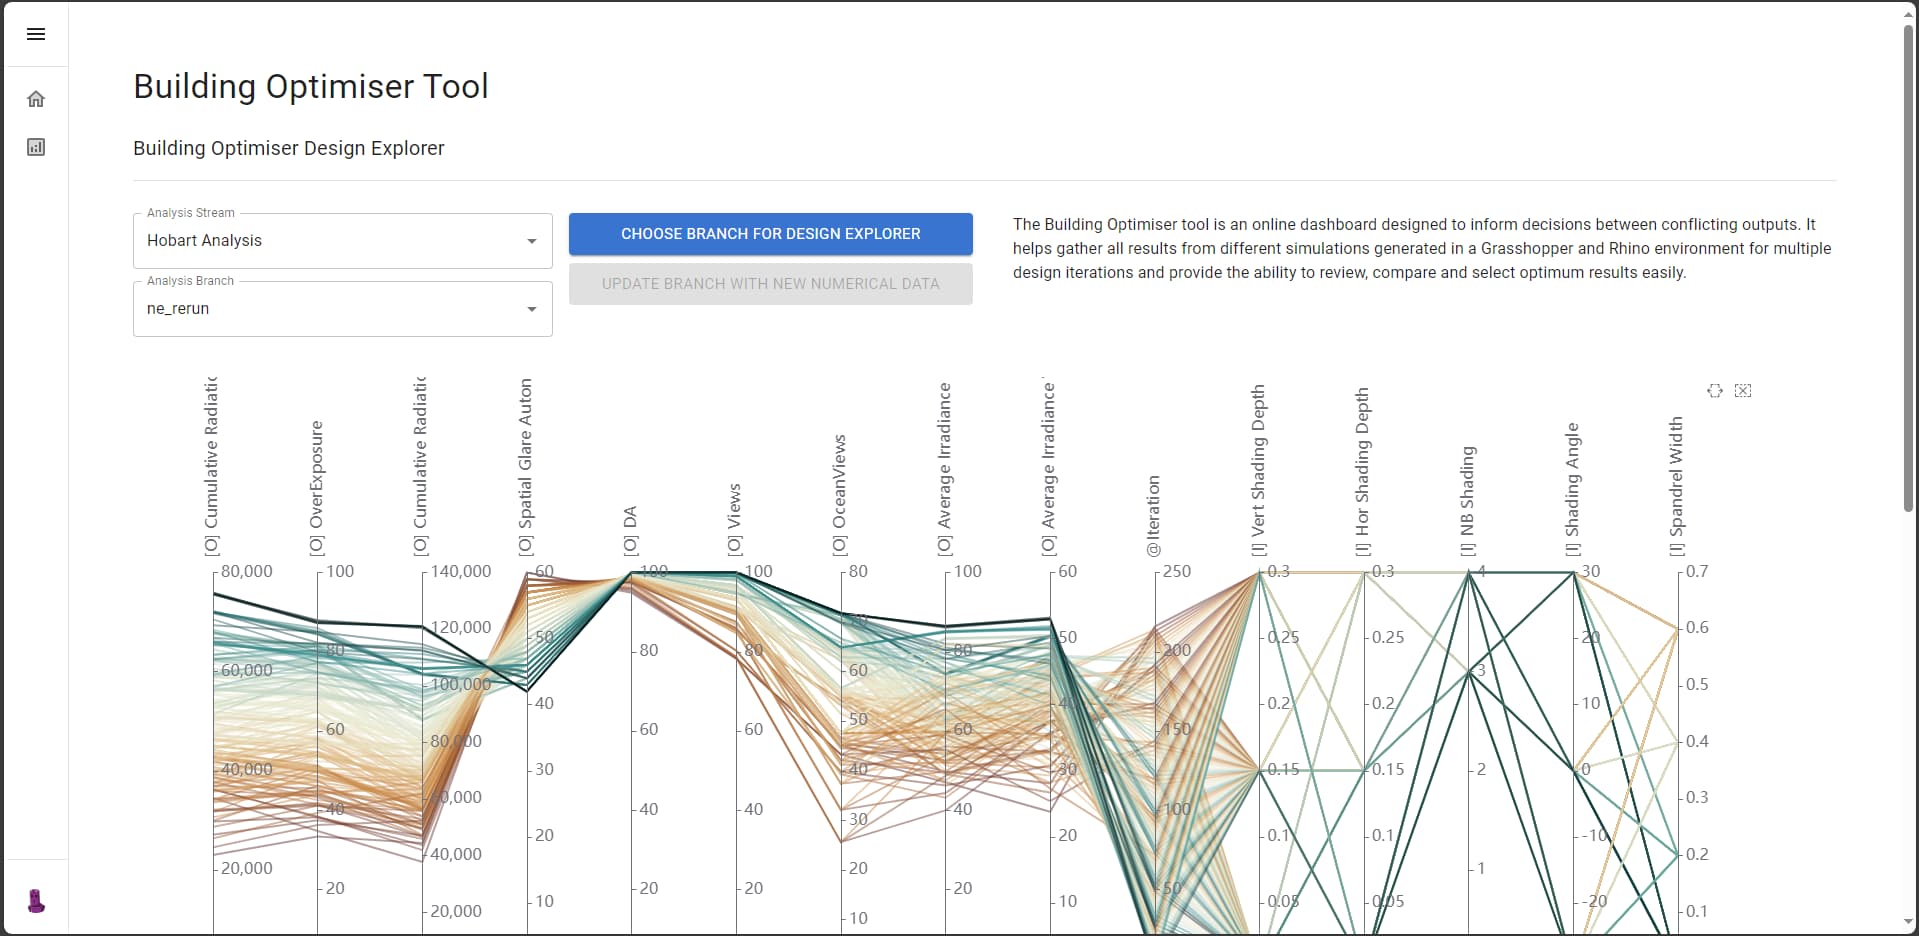
I’ve used the Speckle Viewer API to build a data driven options explorer app. This is to allow us to quickly use a parallel graph to find the best fit for our engineering studies in building sciences.
Integration Approach
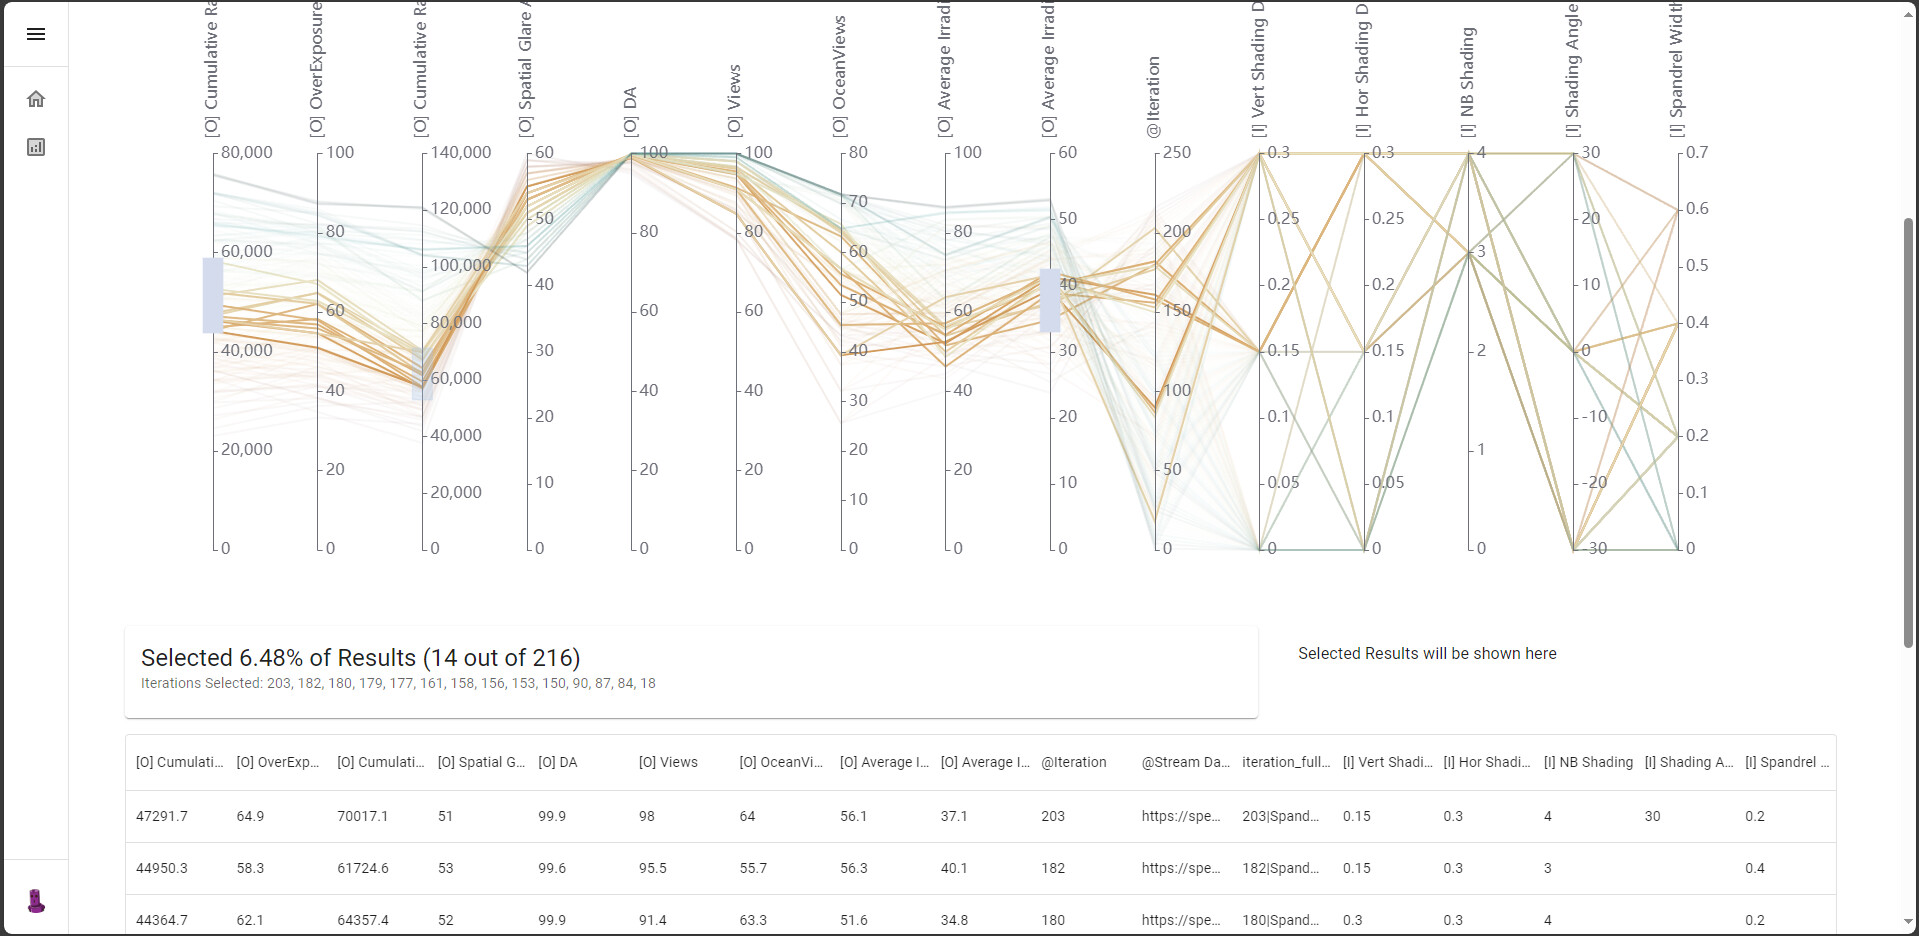
Data is stored in multiple speckle commits, the app pulls all of it into one place during the data selection / filtering process.
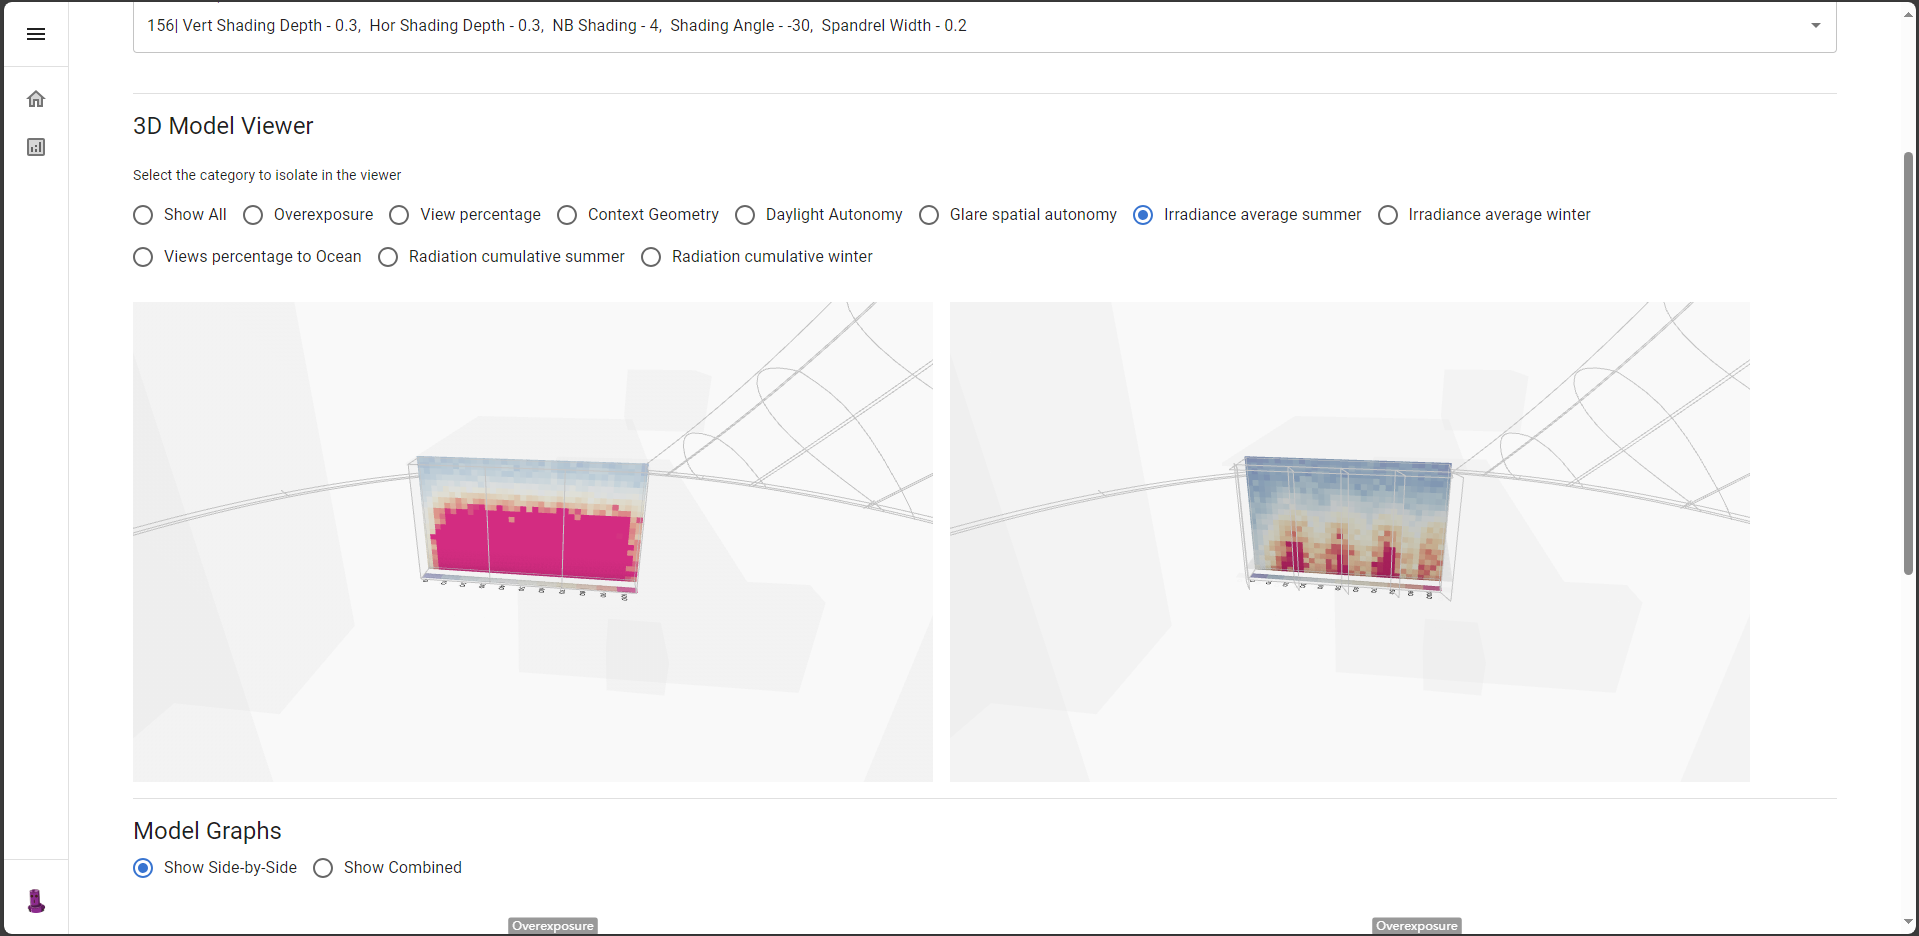
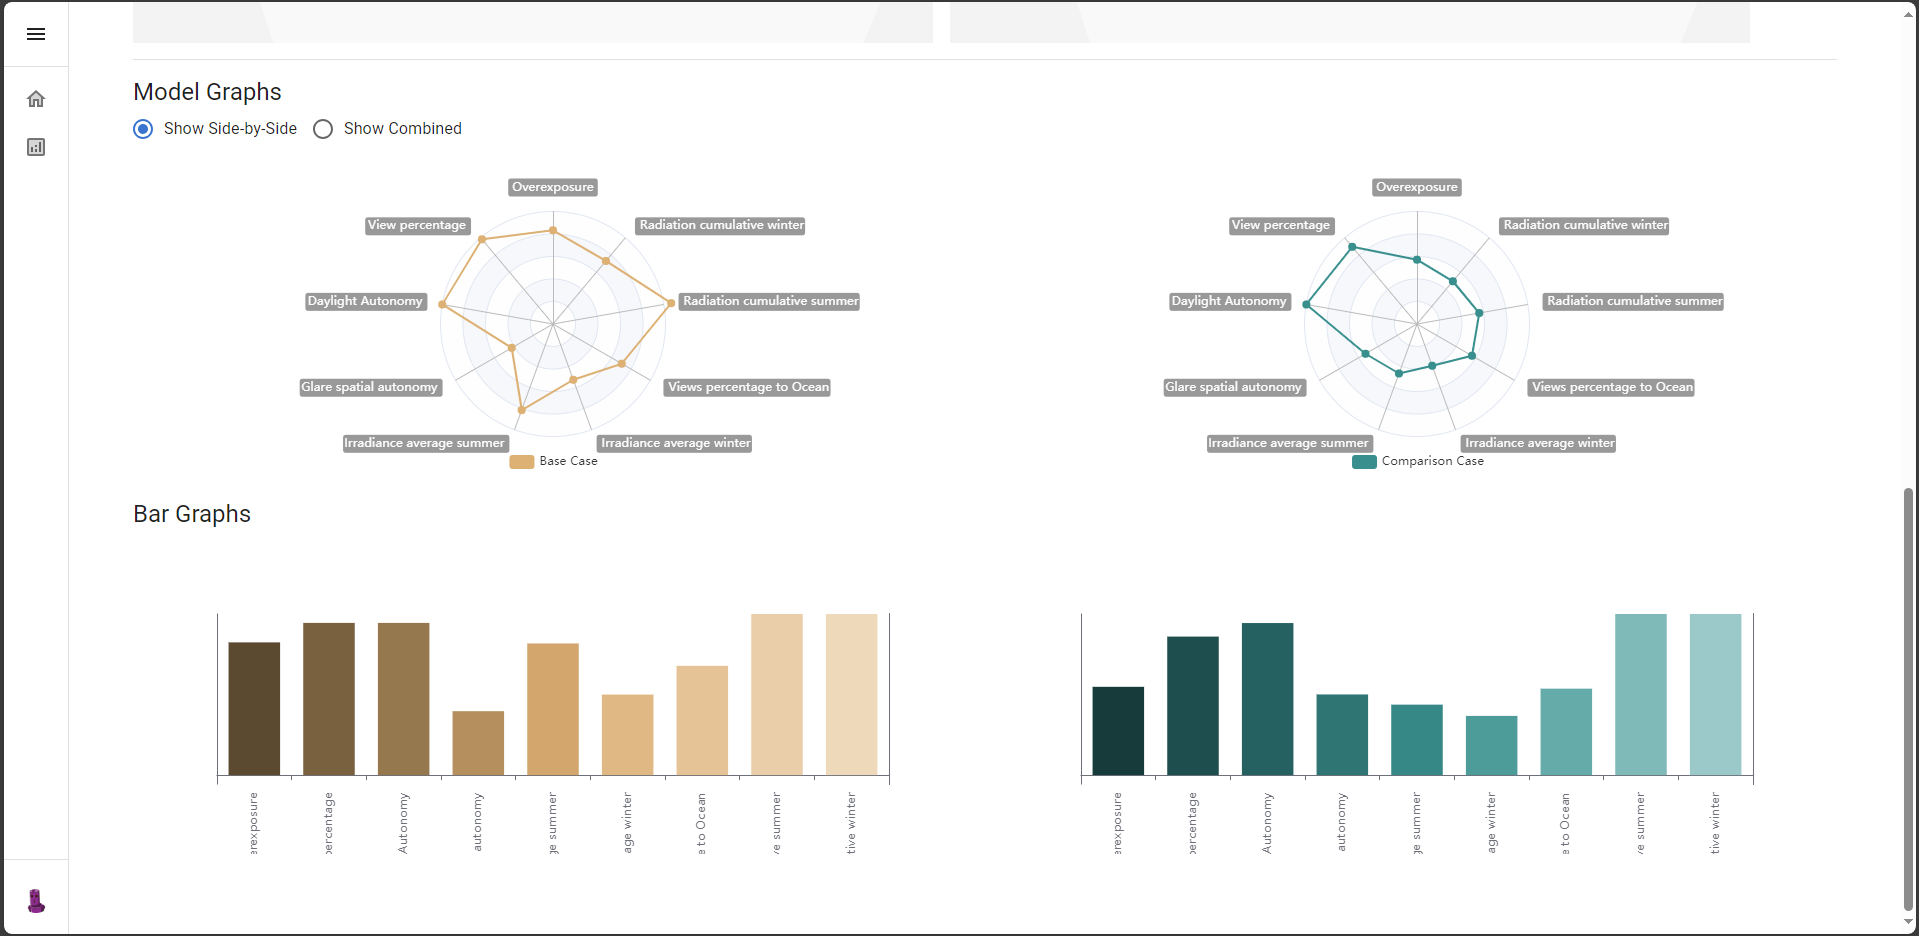
The results is then able to be investigated further using a custom built Viewer showing 2 different models, with the camera positions / filteringID’s and movements being synchronised between the two. The data is then presented in comparison graphs.
The app is built with React and Typescript.
Community Tips and Insights
- Lessons Learnt 1.0 - Synchronising viewer information was the most challenging part of this piece, as tehre were a lot of quirks with the viewer itself that I had to account for. e.g. waiting for the mousemovements before updating the other viewer vs not waiting too long for the experience to not be instantaenous and potential conflicts of inputs between the two viewers.
- Lessons Learnt 2.0 - Having a defined schema beforehand would definitely help with the graphing of information down the line. We needed to define this early and be able to account for potential changes in data structure to accurately display the graphs. As well as considering how many nested layers of information there is.